App marketers shouldn’t underestimate the importance of determining their average app user acquisition cost. It’s the driver for increased profit margins, sustainability, reduced costs, and better Customer Lifetime Value (LTV), to name a few. To understand average customer acquisition costs, developers need to calculate their user acquisition cost by unit or user. Also known as a Customer Acquisition Cost (CAC), getting hold of this figure drives higher profit margins and helps to manage user acquisition activity. From Apple Search Ads to influencer marketing, being successful across user acquisition channels relies on accurate financial analysis and precise calculations. But it’s getting to the bottom of your app user acquisition cost that’s the beating heart of the process.
To this end, this research page highlights the importance of understanding average customer acquisition costs (CAC) when planning and budgeting for user acquisition. Many factors can influence mobile app acquisition costs including CPI, CPA, and LTV metrics. But we should also consider potential costs from third-party providers like agencies, consultants, and the use of subscription software.
Featured User Acquisition Platforms and Agencies
Other influential factors for calculating mobile app acquisition costs include location, mobile operation system (OS), vertical, and the choice of social media or app acquisition channels like TikTok, Facebook or Instagram. With the landscape for mobile user acquisition changing all the time, an average cost-per-user acquisition rate helps to keep costs low and profits high. So, read on for guidance on how to calculate your own customer acquisition cost, what to include, and which factors will influence it.
Average CAC Key Data Points
- Global spending on digital marketing in 2023 – $526 billion (Dentsu)
- Forecasted global digital marketing spend in 2029 – $936 billion (Dentsu)
- Customer Acquisition Costs (CAC) have surged by 222% over the last decade, rising from $19 to $29 per user (SimplicityDX)
- The average price of in-app purchases for iOS rose by 40% between 2023 and 2022 (Apptopia).
- On average, CPI for iOS is $5.11 and $4.61 for Android in 2023 (Mapendo)
- EMEA average CPI is between $1.75 and $4.50 in 2024 (Mapendo)
- US average CPI is between $2.50 and $5.00 per user (Mapendo)
- Gaming average CPI was $4.83 in 2024 (Liftoff)
- The US spending on user acquisition campaigns for shopping apps reached $6.6 billion in 2023 (Mapendo, AppsFlyer, Sensor Tower.
- North America attracts an average CPI for Shopping apps between $2.5 and $5.00 while Latin America offers the lowest between $0.50 and $2.00 (Sensor Tower).
- Fintech apps’ average CPI in 2024 is between $2.50 and $6.00 (Adjust, Juniper Research)
- Facebook ads’ average CPI in 2024 is $2.09 (Amplitude Marketing, Hunch Ads)
- The average CPI for Instagram ads in 2024 is between $1.75 and $4.50 (WordStream)
Category Leaders Choose the Right Growth Agency
Join leading brands like Google, Reddit, and Uber in taking the next step towards success using Moburst, where surpassing goals is just the beginning.
Learn more >App user acquisition cost definition
App user acquisition cost is a reference to the total expenditure paid out to acquire new mobile app users. It’s calculated by dividing the total amount spent on new user acquisition by the number of users acquired. It’s also a specific type of Customer Acquisition Cost (CAC). Bear in mind that CAC is a reference to the cost of acquiring a single app user rather than total app users.
Marketers can use strategies like paid advertising and increasing organic traffic to run acquisition campaigns. But there are many other user acquisition strategies like App Store Optimization, affiliate marketing, content marketing, email marketing, and offline marketing to consider. What’s essential for understanding mobile app acquisition costs is having to hand a figure to highlight mobile app users’ lifetime value. So, let’s look closer at some definitions.
What is LTV?
Lifetime Value (LTV) represents the average net profits an app developer makes over the lifespan of a single app user. It’s sometimes referred to as Customer Lifetime Value (CLV or CLTV), but is in actual fact different from LTV since CLV or CLTV reflects revenue generated from a single user. LTV reflects the end result of investment into CPI or CPA, where developers will pay to acquire new users. And it helps to understand the value of acquisition costs by measuring the cumulative average profits users generate over the course of their time on the app. Plus, since app installs won’t always convert to users like in-app subscriptions or freemium apps with paid features, calculating an LTV is helpful for measuring the combined value of user actions over their entire lifespan on your app.
User Acquisition Buyer's Guide
Download our User Acquisition Buyer’s Guide to get a full list of the best service providers on the market to choose from. The guide also covers what is a user acquisition company and how to choose the right one.
What’s the difference between LTV and ARPU?
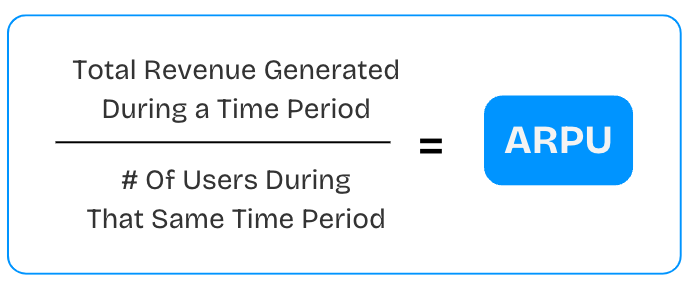
ARPU and LTV are two metrics that represent the value gained from investing in your app user acquisition cost. ARPU is different from LTV and stands for Average Revenue Per User. So, instead of measuring the average lifetime value of users, ARPU measures the average revenue from mobile app acquisition costs at any given or particular time.
MoEngage ARPU calculation
Source: MoEngage
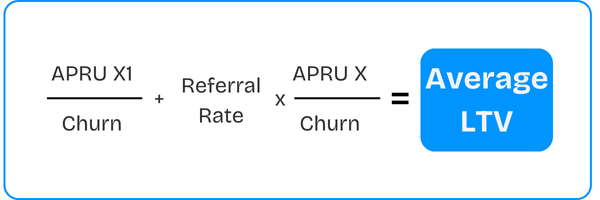
A helpful blog post from MoEngage shows how to calculate LTV using ARPU and churn rate. It also describes how three variables can influence LTV calculations: Monetization, Retention, and Virality.
- Monetization: ARPU is a helpful metric for gaining an average value or figure as a snapshot of all acquisition activity, whether that’s Paid Ads, organic installs, social media, or in-app subscriptions.
- Retention: Churn Rate can help reveal retention levels. Churn represents the number of app users who left divided by the number of users at the start plus new customers.
- Virality: This means the number of referrals made by app users. So a referral rate of 0.5 means one in two users will refer their friends.
Using these metrics can simplify LTV calculations and distill figures into manageable chunks when working across a range of acquisition channels.
MoEngage average LTV calculation
Source: MoEngage
With this rate in hand, marketers can then focus on deploying tactics to increase LTV. Focusing on mobile app retention strategies, for example, can reduce churn rates. And marketers should find ways to mitigate extra concerns such as mobile ad fraud.
Why knowing your mobile app user acquisition cost matters
With a strong idea of your mobile app user acquisition cost, it’s easier to plan your spending and decide on the most appropriate marketing activity. According to the report by Factual Market Research, digital marketing costs are increasing, with global spending on digital marketing amounting to $526 billion in 2023 and by 2029 is expected reaching to $936 billion.
Worldwide digital marketing spend in 2023 – 2029 ($billion)
Source: Factual Market Research
Meanwhile, the e-commerce optimization platform SimplicityDX data shows how customer acquisition costs have risen by 60% in the last five years to 2024. It suggests there are several influential factors for the increase including the introduction of Apple’s iOS 14.5, which limits tracking capabilities, the demise of third-party cookies, and the impact of stricter consumer privacy legislation like CCPA and GDPR. Founding director and chief strategy officer for SimplicityDX, Charles Nicholls, says the average CAC has risen to $29 for every new user. And this represents an increase of over 200% since he carried out a similar analysis back in 2013.
Rising costs are not the only reason why it’s a good idea to focus on reducing your app user acquisition cost. Here are a few others to consider:
Effective planning
It’s much easier to achieve profitable marketing and acquisition activity with a better understanding of your app user acquisition cost. Using cost data helps to make more informed and strategic decisions. For instance, 40% of Gen Z, or the digital native generation, choose to engage with social media over search. And with a better understanding of costs, it’s easier to determine whether meeting the demand for social media influencer marketing could be a cost-effective user acquisition strategy.
Competing with others
With a firm idea of your mobile app acquisition costs, you’ll be better placed to stand out from your competitors through novel approaches and unique strategies. Lower app user acquisition costs can result in more available funding to invest in innovation, design, and UX.
Sharing results with stakeholders
Reducing app user acquisition costs shows senior stakeholders, investors, and senior managers that your strategies are financially viable. Plus, with better evidence of engagement with your app, you’ll confirm your decisions and keep investors in the loop.
Investing in retargeting
Better insights into the costs involved in running user acquisition campaigns result in more informed retargeting strategies. Stats suggest that over 70% of users give up on an app after the first day of use. But effective retargeting can aid in boosting lifetime value and reducing Customer Acquisition Costs.
Factors that can influence customer acquisition costs
Many factors influence mobile app user acquisition costs. And since successful acquisition campaigns are complex, marketers have to make many cost-based decisions by reviewing the variables. Below are some of the more critical factors that can influence customer acquisition costs.
CPI Rate
Cost-Per-Install rates can have a huge impact on an app user acquisition cost. You can calculate your own CPI by dividing the total amount your spend on digital ads by the number of installs. Stepping into new areas may mean searching for benchmarks to help plan your budget. And to give you an example, the average mobile app CPI can vary in different territories. This year for APAC it is between $1,5 and $3.00, in EMEA – between $2,00 and $4.00, in Latin America is between $0.50 and $2.00 and between $2.5 and $5.00 in North America.
App user action
Mobile app user acquisition cost is also influenced by a range of app monetization approaches. For example, getting a potential user to install an app is the first critical step in the user journey. But, if you’re running a freemium app and hoping to unlock in-app purchases or subscriptions, you’ll need to look beyond CPI to analyze your costs. Converting freemium app users entails significant marketing activity ranging from in-app advertising to retargeting. And this will come at varying costs.
The key user actions that may incur different costs include:
- App installation
- App registration
- In-App Purchases (IAP)
- Purchases
- Subscriptions
In recent times, the cost of In-App Purchases (IAP) has seen rapid growth on iOS. A report from Apptopia shows how the average price of in-app purchases for iOS rose by 40% between July 2021 and July 2022. Such a marked increase could be a reaction to the general increase in median eCPI for Apple in-app purchases, as revealed in the chart below. It may be that these increased costs come from adhering to Apple’s Tracking Transparency (ATT). And, as a result of higher eCPIs on Apple, the cost of IAPs has risen too. This is in stark contrast with Google Play Store, which saw only a 9% increase by comparison.
iOS in-app purchase price rises in 2021 – 2022 ($)
Source: apptopia
Marketing campaign costs
Before engaging in user acquisition activity, you need to carry out some strategic planning for any marketing campaigns. This may include targeting personas and finding new users where they play, both offline and online. Each user acquisition and marketing channel will incur different costs, whether it’s social media, content marketing, or retargeting. Understanding these differences can help with weighing up the pros and cons of investment.
With rising concerns around changes to privacy and the removal of third-party cookies, over 60% of app marketers say they’re now unsure of how to target new app users. The mobile commerce platform Bango has stepped up to help this situation by defining a specific strategy to tackle this issue – ‘Purchase Behavior Targeting’ or PBT. This approach allows marketers to shift focus from ‘who users are’ to ‘what users buy’.
Optimized conversion rates
Promoting higher conversion rates can work to reduce customer acquisition costs. By analyzing campaign performance at each stage of the funnel, marketers can identify areas for improvement and optimization. More specific actions that can optimize conversion rates include A/B testing, simplifying any transactional processes, increasing personalization, and retargeting.
Sales expenses
Along with audience targeting, there could also be some sales expenses to add on to app user acquisition costs. For offline sales, this could involve Press and PR, for instance, such as hosting a stand at an industry conference. But it could also feature face-to-face sales to affiliate marketers such as online influencers. They will need a pitch presentation and a point of contact to make the sale, which would add to any cost calculations.
Marketing software costs
There’s a variety of SaaS marketing tools and platforms marketers can use to aid in fast and effective user acquisition. For instance, an influencer marketing platform can cost around $10,000. And where other acquisition strategies like ASO are also likely to be high on the agenda, you’ll want to review which ASO tool would be best for your plans. AppTweak, Storemaven, SplitMetrics, and Gummicube are a few worth reviewing.
Additional services
Depending on the extent of your user acquisition strategy, it’s likely you’ll need to engage in additional services. For example, if you’re going down the influencer marketing route, you’ll find that agency fees can range between $10k – $18k per month.
If you’re a smaller business or starting out, it may be easier to partner with a consultant or a user acquisition company. By employing their expertise and knowledge of current trends, you could add benefit your bottom line and increase the odds of high conversion rates.
Now, when we’ve got a good look at factors that influencer customer acquisition costs, let’s turn to how app user acquisition costs vary by mobile operating system.
App user acquisition costs by Operating System (OS)
Knowing how to calculate a customer acquisition cost relies on strong data analysis. So, let’s start with an explanation of the differences between the operating systems aka iOS and Android. For many years, the global cost to acquire Android app users has been far lower than iOS. And a big driver for this lower cost and CPI is due to the greater volume of Android users around the globe. In particular Latin America, Europe, and Asia.
The average CPI for iOS is now $4.7 and $3.4 for Android. This suggests that not only has the average CPI risen but the historic gap between the platforms is getting smaller. Going back to 2020, we know that app marketers spent an average of $2.7 to generate an Android app install versus $3.6 for iOS. By 2021, pricing for both increased while the gap remained, specifically the CPI for iOS was $3.8 and for Android it was only $2.9.
Then, in 2022, the gap between iOS and Android CPI increased to $1.1 and up. That year, the average user acquisition cost was $3.00 for Android but $4.1 for iOS. By 2023, the average CPI for iOS was $4.5 and $3.2 for Android. In 2023, the gap remained and even increased – the CPI for iOS was $4.5 in a sharp contrast with only $3.2 for Android. This year, the forecast predicts iOS CPI reaching $4.7 and the Android counterpart only reaching $3.4.
Average mobile app user acquisition cost per install, by platform in 2020-2024 ($)
Sources: Apptopia, AppsFlyer, Adjust
Next, let’s take a look at the customer acquisition rate for both iOS and Android in different countries.
App user acquisition costs by region
There are stark differences in-app user acquisition costs between geographical regions. For instance, North America has a tradition of having the highest CPI rates while EMEA is driving around 50% of worldwide app ad sales.
As outlined in the chart below, variations exist between countries and regions. Levels of affluence and affordability can influence these differences. But there can also be other reasons, such as Google Play not being accessible to users in China. The alternative is several third-party providers that replace Google Play. And these variations will alter CPI data and total spending results. Recent introduction of third-party iOS app stores in Europe is yet to influence the numbers you can see on chart.
2024 research from Mistplay and Mapendo reveals how the average CPI for the North America remains stable at $5.28 per mobile app user, $0.17 up from the previous year. For a long time, North America has had the highest CPI rates. EMEA holds the second place with $1.03 per mobile app user, $0.05 increase from 2023. The APAC region holds the third place with $0.93 per install, yet another small increase from the previous year – $0.08 per install. Latin America closes up the chart with only $0.34 per a mobile app user, a mere 4 cent increase from 2023.
2024 average mobile user acquisition costs, by region ($)
App user acquisition costs by vertical
By now the app market has reached maturity and therefore data is more segmented. This will help when considering particular verticals or industries since costs vary between each. But they’re also influenced by different factors like audience profile and levels of demand. The most popular verticals are now mobile gaming, fintech, health & fitness, social media, shopping, and entertainment & streaming. Among these three verticals are now major revenue drivers for the app industry – gaming, retail, and fintech.
According to Liftoff’s Casual Gaming Apps Report 2023, the average CPI for gaming was $1 dollar in 2022/23. The report also showed how Simulation games had the lowest average CPI rate at $0.59 per install and that mobile app acquisition costs differ between platforms, with the acquisition on iOS at $2.23 and Android three times lower at $0.63. And while consumer spending on casual gaming has dropped by around 5% in 2022, data.ai’s ‘State of Mobile 2023’ report indicates consumers spend most on RPG and Strategy games. They’re also downloading Hypercasual and Simulation games the most – 17.5B and 10.1B respectively. The average worldwide CPI for casual gaming apps has reduced in recent years, and Statista reports how the average global CPI has dropped in recent years to $0.98, confirmed in the report from Liftoff.
Cost per install (CPI) of casual gaming apps worldwide in 2019 – 2022
Source: Statista
Next up is the Shopping app category, which includes eCommerce and retail apps. Demand has increased for Shopping apps following the pandemic. And these needs have been served well by the emergence of robust mobile payment systems, larger smartphone screens for viewing goods, longer battery life, and the proliferation of 4G and 5G mobile connectivity.
Data.ai’s report also shows that consumers spend almost 110B hours on Shopping apps while research by Mapendo shows the US attracts a third of global spending on user acquisition campaigns for shopping apps. And, in terms of calculating a customer acquisition rate, Statista indicates that North America attracts an average CPI on shopping apps of $4.74 while Latin America offers the lowest at $1.42.
Average cost per installation (CPI) of shopping apps worldwide as of May 2022, by region
Source: Statista
Last but certainly not least is Finance or Fintech apps. These include banking apps, payment apps, and investment apps. With economic belts tightening and inflation rising, CPI for finance apps continues to drop. Liftoff’s 2022 ‘Mobile Finance App’s Report’ suggests the average CPI for Fintech apps in 2022 is now $2.33, reducing down from 2021’s average of $2.45. They also note a lowered Year-on-Year CPI for Android at $2.09 compared to $4.35 for iOS. The report also showed how LATAM users are the most cost-effective at $1.60 CPI, although they tend to register at lower rates of 18.3%.
Finance apps CPI decline by month, 2022
Source: Liftoff
App user acquisition cost by social channels
For social channels, getting hold of an app user acquisition cost is more elusive for TikTok and Twitter. But with TikTok’s dominance over the scene, we expect data sources to track CPI over time. Meanwhile, let’s look at the cost of Facebook Ads because–before Apple’s deprecation of IDFA in 2020– Meta’s Facebook used to be the most effective mobile app user acquisition platform on the planet. Thanks to the number of data points Meta has been collecting for several billion of its users, Facebook Ads was, and to a lesser degree is, in a great position to provide app marketers with a platform to connect their apps with relevant mobile app users.
Facebook ads cost
The price of acquiring a single mobile app user via Facebook Ads has done a full cycle from 2018 to 2023. CPI went up from $2.25 to $3.75 between 2018 and 2020.
In 2021, because of Apple’s deprecation of IDFA and switching app tracking from an opt-out to an opt-in model–Meta lost its ability to target mobile app users across multiple iOS apps. As a result, many advertisers moved their app user acquisition budgets to other advertising platforms. This caused Meta’s revenue to collapse from $84 billion in Q3, 2021 to $28 billion in Q3, 2022. It lead to Facebook CPI for mobile apps shooting up from $3.75 in 2020 to stunning $15 per a mobile app install in 2021.
In 2022, when Facebook managed to substitute its lost ability to track iOS app users across multiple apps with sophisticated ML-based algorithms, Facebook Ads CPI went down to $3.75 per app install and in 2023 it slightly (compared with the astonishing change in 2021) went up to $4.75.
Facebook Ads app user acquisition cost ($)
Sources: Revealbot, adespresso
For Instagram, things have looked quite different. After Facebook acquired Instagram for $1 billion back in 2012, Instagram Ads operated as a standalone platform. Soon after Facebook Ads incorporated it into their platform as an extra option. Doing so provided new distribution opportunities by tapping into a vast user base with a diverse set of interests. For instance, let’s take a look at app user acquisition cost when driving app installs via Instagram Ads. Then we can contrast pricing with the last few years.
In 2018, 6 years after its acquisition by Facebook, app marketers had to pay $2.75 per single mobile app install. By 2020 the price went up to $4.25 per install. We can attribute such a spike in user acquisition price to the COVID-19 global pandemic which caused a massive increase in mobile apps usage.
In 2021, Instagram Ads’ CPI rate shot up to $15.00, caused by the impact to iOS 14.5 privacy changes. In 2022, just like for Facebook Ads, the average CPI went down to $5.50 per install. In 2023, the price for a mobile app install generated via Instagram ads went up again, driven by high demand and privacy legislation impacts.
Instagram ads Cost Per Install ($)
Sources: Revealbot, AdsEspresso, WordStream
User acquisition companies
Engaging with mobile app user acquisition often starts via a third-party agency or company. And it’s a popular thing to do since many companies offer up-to-date expertise, guidance, support, and a comprehensive approach that helps reduce your mobile user acquisition cost.
With the flexibility and resources to create better personalization and targeted campaigns, analyze results and test new approaches, user acquisition companies offer high levels of value to clients. To illustrate the point, here are three examples of partners that can help in this area.
Moburst
Moburst is a leading mobile app acquisition agency and is a one-stop shop for all your mobile acquisition needs. They offer services through ASO, ASA, mobile strategy, influencer marketing, and product strategy along with expert knowledge and dynamic awareness of a shifting mobile marketing landscape.
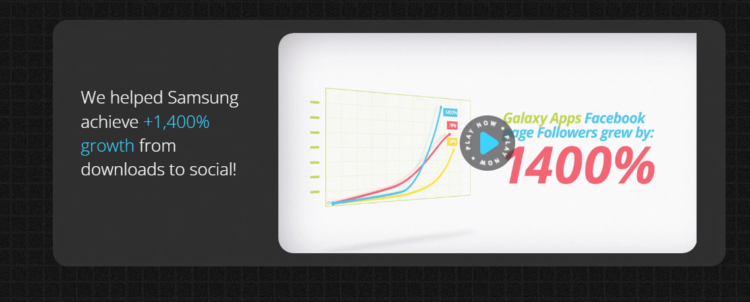
In a campaign with Samsung Galaxy App Store, Moburst transformed its marketing to increase revenue by 36% and downloads by 79%.
Screenshot from Moburst Case Study with Samsung
Source: Moburst
Favoured
An app marketing agency based across the UK, Favoured offers data-driven, full-funnel performance marketing and app marketing services.
Helping to reduce the cost of user acquisition, Favoured help their clients to get more users and more revenue. And a good example is when they worked with the subscription app Oddbox. By creating a unique approach to remarketing and micro-influencer marketing, Favoured helped the food delivery app gain 1,500 new subscribers and 45% better retention.
Screenshot from Favoured Case Study with Oddbox
Source: Oddbox
Perform[cb]
Perform[cb] is a leader in the performance marketing industry and provides app developers and marketers with a range of features to drive user acquisition including ASO, real-time reporting, and customized dashboards. They’re committed to quality, compliance and offer an omnichannel approach that can lower your user acquisition cost.
A case example is where Perform[cb] drove user acquisition to over 200,000 total installs in the last quarter for a shopping app that wanted to increase holiday traffic to the app.
Screenshot from Perform[cb] case study with eCommerce app
Source: Perform[cb]
Final Thoughts
Determining your mobile app user acquisition cost is a fundamental part of any user acquisition strategy. It’s useful for benchmarking activity, analyzing performance, and ensuring prudent financial investment. The industry is shifting away from a former reliance on CPI to more CPA. As a result it’s becoming more difficult to be precise when calculating a user acquisition cost.
While fewer platforms are sharing CPA data, app marketers can still calculate the Customer Acquisition Cost and lifetime value (LTV) of mobile app users. Doing so can support estimations for average mobile app user acquisition costs across verticals, with the most available data on costs coming from Shopping, Finance, and Gaming apps.
With plenty of channels including ASA, ASO, and social media to consider, app marketers may find it cost-effective to partner with user acquisition companies or agencies, Doing so can leverage a full-service approach. Plus, enlisting such help can reduce your mobile app acquisition costs in the longer term and result in useful insights that inform your strategy.


