
Today, the bulk of digital advertising is run on mobile devices. To plan and run their mobile advertising campaigns, advertisers need metrics to assess future expenses or to compare current campaigns’ performance against the industry benchmarks. Of course, costs are the staples of ad metrics.
The most basic and fundamental costs that define mobile advertising are Cost Per Mile (CPM rates) and Cost Per Click (CPC rates).
In this article, we’re taking a close look at CPC rates for the last five years. As a metric, Cost Per Click rate has a long history, back in early 2000s – before the mobile era began in 2007 – it was the metric for any online advertising campaign. All major paid advertising platforms, back in the day it was primarily Google, helped online marketers to drive traffic to their websites via ad campaigns based on the CPC model.
EVADAV Performance Group
Get clicks, installs and leads. Elevate your profits with EVADAV traffic.
Register nowIn the world of mobile advertising, the mobile CPC rate allows advertisers to measure the cost of the most basic interaction between a mobile ad and mobile user. It is the first step that enables mobile marketers to access the efficiency of an ad campaign they run. CPC rates vary by region, industry, and fluctuates in sync with seasonal events, such as Christmas, Black Friday, Easter, and so on. The Cost Per Click is a solid indicator of a competition level in your industry, knowing average rate for your vertical, you can adjust how much you’re paying for a click in your paid mobile user acquisition campaign and avoid overspending.

Let’s give a formal definition for what is Cost Per Click.
What is Cost Per Click (aka CPC)
Cost per click advertising (CPC) is a pricing model used in mobile user acquisition campaigns in which app advertisers pay each time a mobile user clicks on their in-app ad.
The formula to calculate CPC is:
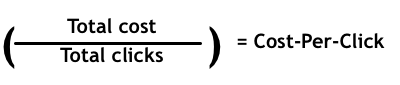
Yes, it’s a simple but yet powerful metric for mobile marketers to assess efficiency of their marketing budget spend.
Boiling down average CPC rates for all major ad platforms you can use to drive traffic to your mobile app, we get the following list.
Key Cost Per Click Statistics:
- Google Ads CPC rate (Search) – $2.69
- Google Ads CPC rate (Display) – $0.63
- Facebook Ads CPC rate – $0.63
- Instagram Ads CPC rate rage – $0.40 – $0.70
- X Ads (former Twitter Ads) CPC – $0.38
- LinkedIn Ads CPC – $5.58
- Pinterest Ads CPC range – $10 – $1.50
- Amazon Ads CPC rate – $0.91
Now, mobile advertising landscape provides businesses with a lineup of digital advertising platforms to grow their brands, reach new customers and generate revenue. This landscape consists of advertising platforms such as Google Search and Display Ads (from Alphabet), Facebook and Instagram Ads (from Meta), Amazon Ads, X Ads (former Twitter Ads), Linkedin Ads, Pinterest Ads. As well as the second tier players – mobile ad networks such as Applovin, UnityAds, ironSource. and Vungle.
Featured CPC Advertising Networks
Taking an overview look at all these advertising platforms, we see that LinkedIn Ads features the most expensive CPC rate – $5.58 per click, followed by Google Search Ads with $2.69 per click, Amazon Ads – $0.91 per click and Twitter Ads is the least expensive – just $0.38 per click on a mobile ad.
One of the most interesting players on this market is Amazon, which debuted its online advertising platform Amazon Ads in 2012 and since then raised to number three, in terms of the volume, after Alphabet And Meta. In 2024, a click on an ad on the Amazon Ads platform costs $0.91.
Source: SparkLaunch Media, Semrush, LocaliQ, Wordstream, AdEspresso, Revealbot
Now, since Google and Facebook Ads are two dominate forces on the mobile advertising landscape, let’s look at how Cost Per click rates fluctuate over time for these two.
Facebook and Google Ads cost per click rates
With Facebook Ads, the platform provides advertisers with a broad spectrum of advertising tools to reach target audience via its app on desktop and mobile, as well as on Instagram, WhatsApp and via its Audience Network that serves thousands app developers with target ads that match their app users interests.
Google Ads platform gives mobile advertisers access to audiences interacting, on both desktop and mobile, with Google Search, YouTube, Google Display Network videos and publishers mobile apps.
To put things in perspective for the average CPC rates in the mobile advertising industry, let’s look at how Google and Facebook Ads CPC rates fluctuate over the last five years.
Throughout this period, the Cost Per Click for Google Search has always been higher than its Display Network counterpart. Advertisers value on being on the top of Google’s search results more than being advertised with a banner in Google’s inventory. The logic is simple – people are much more likely to interact with ads in search results, when their intent is strong, in contrast to display banners.
In 2019, the pre-pandemic year, CPC rates for Google Ads were: Display Network CPC – $0.63 and Search Network CPC – $2.69. In 2020, the year when the global pandemic hit, the price of a click collapsed to just $0.58 for the Display Network and $2.41 for the Search Network – advertisers were pulling out their ad budgets in masses that lead to a competition decrease and hence the low CPC rate. In 2021, when the world was slowly but surely recovering, Google Ads CPC rate shot back to $0.63 for the display and $2.69 for the search, in other words – it got back to the pre-pandemic level.
Over the course of 2022-2023, both display and search network CPC rates grew significantly, in 2022 reaching $2.96 for the Search Network CPC and $0.69 for the Display Network CPC, in 2023, respectively $3.09 and $0.72. For 2024, it’s projected that Cost Per Click on Google Search will actually decrease to $2.69 and for Google Display the rate will be $0.63.
Google Ads Cost Per Click (CPC) 2019-2024 ($)
Source: Wordstream. Search Engine Journal, LocaliQ, AdEspresso
Switching to how the Facebook Ads CPC rate has been changing over time. Just like the rest of the digital ad industry, Facebook Ads got hit in 2020 and then began to recover. In 2019, the pre-pandemic year, a click on the Facebook Ads platform cost $0.45, in 2020 it went down to $0.39 and then, in 2021, it got up almost to the pre-pandemic level – $0.44 per click.
Facebook Ads Cost Per Click (CPC), over time
Source: WordStream, Hootsuite, Revealbot, AdEspresso, LocaliQ
Transitioning from Facebook Ads CPC over time to Cost Per Click rates for high-value industries on the Facebook’s advertising platform, such as Finance, Internet & Telecom, Business, Home & Garden, Jobs & Education.
The highest, $3.89 per click, rate, among all five industries scrutinized, is for Finance and for a good reason – mobile payment systems and banks expect to extract a great value with the customers base and hence are willing to spend a lot to get people to click on their ads on the Facebook Ads platform.
On the other end of the spectrum is Jobs & Education with $2.11 per click. This industry is presented with businesses that aren’t as generous with how much they spend on ads on Facebook, let alone universities that have much smaller budgets to run ads on Facebook Ads.
Facebook Cost Per Click (CPC), by industry ($)
Source: WordStream, LocaliQ
And finally for Facebook, we’re looking at the CPC rates for different countries. The US and Canada dominate the Facebook Ads CPC rates with $0.97 per click, followed by Australia with $0.90 per click, the United Kingdom is next with $0.85 per click, Germany – $0.80 per click. India, one of the biggest Facebook markets, is a distant number five with only $0.15 per click.
Facebook Ads Cost Per Click (CPC), by country ($)
Source: WordStream, SocialAppsHQ, Shopify, WebFX
Slicing Cost Per Click rates by industry, we see Google Ads follows a similar trajectory as Facebook Ads – Finance leads the pack with $5,16 per click, in the Business industry advertisers pay $3.8 per click, Internet & Telecom – $3.0 and the cheapest rate is again for Education – $2.45 per click.
Google Ads Cost Per Click (CPC), by industry
Source: WordStream, Search Engine Journal, LocaliQ, AdEspresso
The picture of the mobile advertising landscape would be incomplete if we don’t take a closer look at the Amazon Ads platform we mentioned at the beginning. Let’s see what CPC rates for this platform have been over time, by industry, and by location.
Top Mobile Advertising Companies
Amazon Ads CPC Rates
Digital advertising isn’t something that comes to mind when you think about Amazon but back in 2012 the company launched its advertising platform. Initially, the idea was to help sellers and vendors to promote their products on Amazon. Since then, Amazon has dramatically expanded and improved its ad platform with more formats, better targeting, and a wider reach. Specifically for mobile apps promotion, the platform offers such solutions as Sponsored Display Ads, Amazon DSP, Sponsored Brands, Amazon Attribution.
Narrowing down to the Cost Per Click rates and its fluctuations over the last five years, we see the following picture. In 2019, online advertisers who were running ad campaigns on Amazon paid $0.81 per click, in 2020 – due to the pandemic effect – the rate went down to $0.79 click, because many companies stopped their advertising abruptly. In 2021, many advertisers were back to the platform and it caused the CPC rate to shot up to $0.97 per click.
In 2022, the Amazon Ads Cost Per Click continued to grow, passing the $1.00 mark and reaching $1.10. In 2023, the price advertisers were paying for each click on their ads on Amazon Ads platform went up another 10 cents, reaching $1.20 per click.
If the current modeling is on target, we should expect this year the Amazon Ads Cost Per Click to actually go down to $0.91.
Amazon Ads CPC rate, over time ($)
Source: Jungle Scout, Ad Badger, Influencer Marketing Hub, SellerApp
The key factors that influence Cost Per Click rates for Amazon Ads are usual suspects – competition, keyword relevance & demand, product category, targeting options, ad quality & relevance, and others. Among all these factors, I’d like to highlight one – product category – that will give you an insight into what stands the Amazon Ads platform apart from the rest.
Amazon is the biggest e-commerce platform on the planet with lots of different product categories. These categories consist of products with the average order value across a wide spectrum, as well as different conversion rates. Running an ad campaign on Amazon Ads for your app, you need to choose one of those categories. Other advertisers, who run campaigns in the same category, may sell products other than apps with the average order value that is much higher than yours. Therefore, the average CPC for that category isn’t defined by mobile app prices but products that can be much more expensive than your app, meaning the average CPC rate will be high.
Moving along to the CPC rates for a number of industries that are heavily influenced by mobile.
Games are really big not only of the Apple’s App Store and Google Play from Google but Amazon as well and hence the Gaming industry features the highest CPC rate among others – $1.5o per click. Next up is Entertainment – thanks to Prime Video from Amazon – with the average CPC – $1.40 per click. Further down is Health & Fitness with $1.30 per click, Food & Beverage – $1.25 per click, Shopping & Retail – $1.20 per click, and Travel – $1.15 per click.
Amazon Ads CPC rate, by industry ($)
Source: Jungle Scout, Ad Badger, Influencer Marketing Hub, SellerApp
Final Thoughts
On today’s mobile advertising market, although web and mobile marketers focus has been shifting towards CPA, Cost Per Action model, Cost Per Click continues to be an important benchmark that allows mobile marketers to gauge their ad campaigns performance. Knowing certain vertical or location average CPC rate, helps them to assess if they over-spend or, in the case when their spend on a CPC campaign is low, it may indicate them their mobile ads do not generate enough impressions because ad creatives are underperforming or because of some other obscure reason.
Although the mobile advertising space continues to be, for the most part, divided between two giants – Google and Facebook, Amazon Ads has become a clear number three and hence knowing its CPC benchmark is equally important.