Travel apps are poised to generate $1.23 billion in revenue despite prevailing economic challenges, according to new data insights shared by Adjust. With the relaxation of most restrictions and stringent border controls, a trend known as “revenge travel,” people are eager to embark on journeys. Let’s dive in.
Installs beyond pre-pandemic levels
Based on Adjust‘s data, travel app installs exceeded pre-pandemic levels by 18% than the average of Q4 2019. The first half of 2022 saw a 8% year-over-year increase in installations.
Building on this, the first half of 2023 experienced a year-on-year rise of 5%. Notably, June stands out as an active month for travel app installations, often surpassing the yearly average. In June 2021, installations of travel apps were 7% higher than the yearly average. And they were 11% higher in June 2023.
Change in global travel app installs
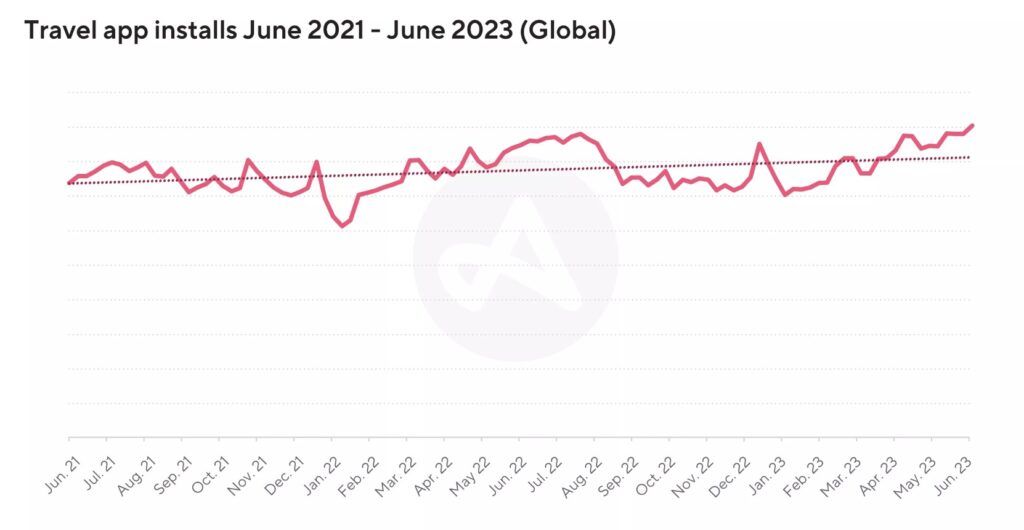
Source: Adjust
Consistent session growth
The data also reveals that travel app usage is on the rise, with users engaging in more app sessions. These sessions are 87% higher than what was recorded in Q4 of 2019. This growth has been consistent and steady over the past two years, from June 2021 to June 2023.
Despite the increased number of sessions, user engagement has not suffered – in fact, it has improved. In 2022, travel app sessions saw a 14% year-on-year increase. In the first half of 2023, sessions are already 13% higher than the 2022 yearly average. These trends suggest that the percentage is likely to continue growing by the end of the year, especially during the summer and holiday travel seasons.

Recognized as the 2023 ASO Company of the Year – ConsultMyApp
Empowering apps for sustained growth since 2016: amplifying visibility, optimizing conversion, and building loyal advocates for your brand.
Claim free ASO audit
Changes in session length
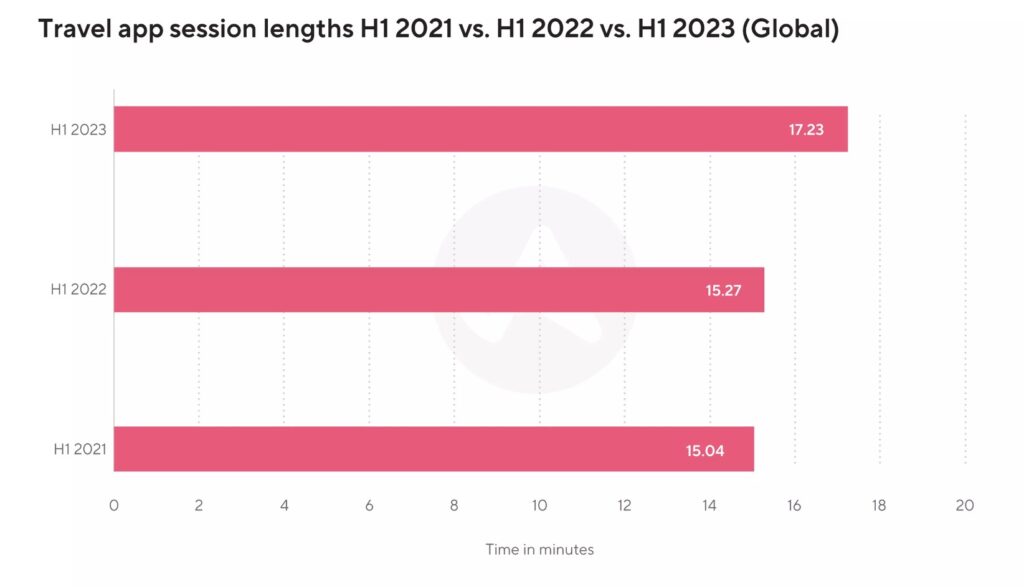
Source: Adjust
What’s more, session lengths also increased year-on-year.
What momentum tells us about retention
The momentum of 2023 surpasses that of 2022, especially when we focus on the sessions each user engages in per day within travel apps. This growth is not solely due to longer individual sessions; rather, users are participating in more sessions overall.
This suggests that the overall increase in sessions is primarily driven by existing users engaging in multiple sessions per day, alongside a notable surge in new installations. This combination contributes to enhanced user retention. In essence, this is an incredibly positive period for travel apps.
Sessions per user per day
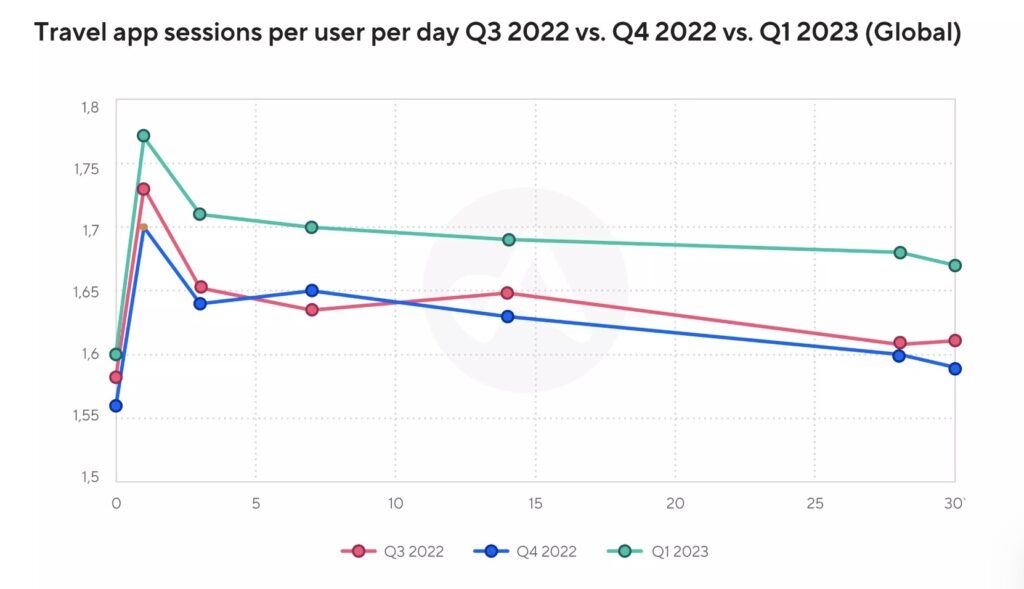
Source: Adjust
When we compare the performance to the preceding two quarters, Q1 of 2023 stands out as a standout performer in terms of the frequency of app sessions per user, as depicted in the chart below.
Key takeaways
- 18% increase in travel app installs compared to the Q4 2019 average. H1 2022 saw an 8% YoY increase, followed by a 5% rise in H1 2023. June 2023 installs were 11% higher
- Travel app usage surges, with app sessions 87% higher than Q4 2019. 2022 witnessed a 14% YoY increase in sessions, while H1 2023 is already 13% above 2022’s average
- 2023’s growth outpaces 2022. Not just longer sessions, but more sessions per user drive overall growth and retention. Q1 2023 boasts exceptional session frequency