Keeping track of your health is, for many people, a continuous task. Monitoring what you eat, how often you exercise and how much water you drink can be time-consuming, fortunately there are tens of thousands of apps that make daily tracking easy.
What started as being able to log health data has transformed into an ecosystem of apps able to personalize weight loss programs, offer alternatives and keep people focused on their dieting and health journey at the pivotal points.
The introduction of fitness trackers and smartwatches provided health apps with a wider field of health metrics to track, letting users know how well they slept, how hard they pushed during a cardio workout, and alert them to some potential underlying health conditions.
Wearable health technology has evolved significantly since the launch of tracking sensors, which were dominated by Fitbit before smartwatches began to command the market. Fitness trackers evolved with the addition of sensors to track heart-rates, temperature, sleep, menstrual cycles and other health information. However, the broader appeal of smartwatches – which can make payments, access social media, open maps and track health – has overtaken the focused fitness trackers.
In a packed field, developers of health apps have had to create niche products aimed at specific tracking metrics. For example, a whole sub-sector has grown out of health for fasting, with apps offering different timers, reminders of when the fast starts, and videos on how to approach fasting.
We have collected data and statistics on the health app sector. Read on below to find out more. If you want to learn more about the health app industry, check out our sector report.
Key Health App Statistics
- The health app industry generated $3.74 billion in 2024, a 9% increase on the previous year
- WeightWatchers generated the most revenue in 2024 at $452 million, followed by Noom
- There were 320 million health app users in 2024
- Health apps were downloaded a total of 388 million times in 2024
Health & Fitness App Report 2025
Want to learn more about the health & fitness app industry? In our Health & Fitness App report, we cover financials, usage, downloads, and demographics by age and gender, alongside market share, engagement, and benchmarks.
Top Health Apps
| App Name | Description | |
|---|---|---|
| https://www.apple.com/ios/health/ | Apple Health | Apple Health collects health information from iPhones, Apple Watches and other devices, sets medication reminders and organises health records |
| https://www.businessofapps.com/data/myfitnesspal-statistics/ | MyFitnessPal | MyFitnessPal contains a database of food items with nutritional values and a fitness segment |
| https://www.businessofapps.com/data/fitbit-statistics/ | Fitbit | Fitness tracker Fitbit includes sensors to track heart-rate, Electrodermal Activity, temperature, sleep and menstrual cycles |
| https://betterme.world/ | BetterMe | BetterMe markets itself as a healthy lifestyle programme without extreme weight loss, focusing on wellbeing |
| https://noom.com | Noom | Weight management business Noom has extended into behaviour change programmes for chronic and non-chronic health conditions |
| https://www.loseit.com/ | Lose It! | Lose It! tracks food and water intake for users to meet diet goals and lose weight |
| https://www.weightwatchers.com/us/ | WeightWatchers | Weight loss programme WeightWatchers converts nutritional information into a points system to track calorie intake |
| https://flo.health/ | Flo | Flo is the most popular ovulation and period tracker, fertility calendar and pregnancy assistant app |
| waterlogged.com | Waterlogged | Water tracking app Waterlogged allows users to set goals on their water consumption and receive reminders to drink |
| https://fastic.com/ | Fastic | Fastic promotes weight loss through a programme of intermittent fasting, mindfulness, improved nutrition and sleep |
Health & Fitness App Market Landscape
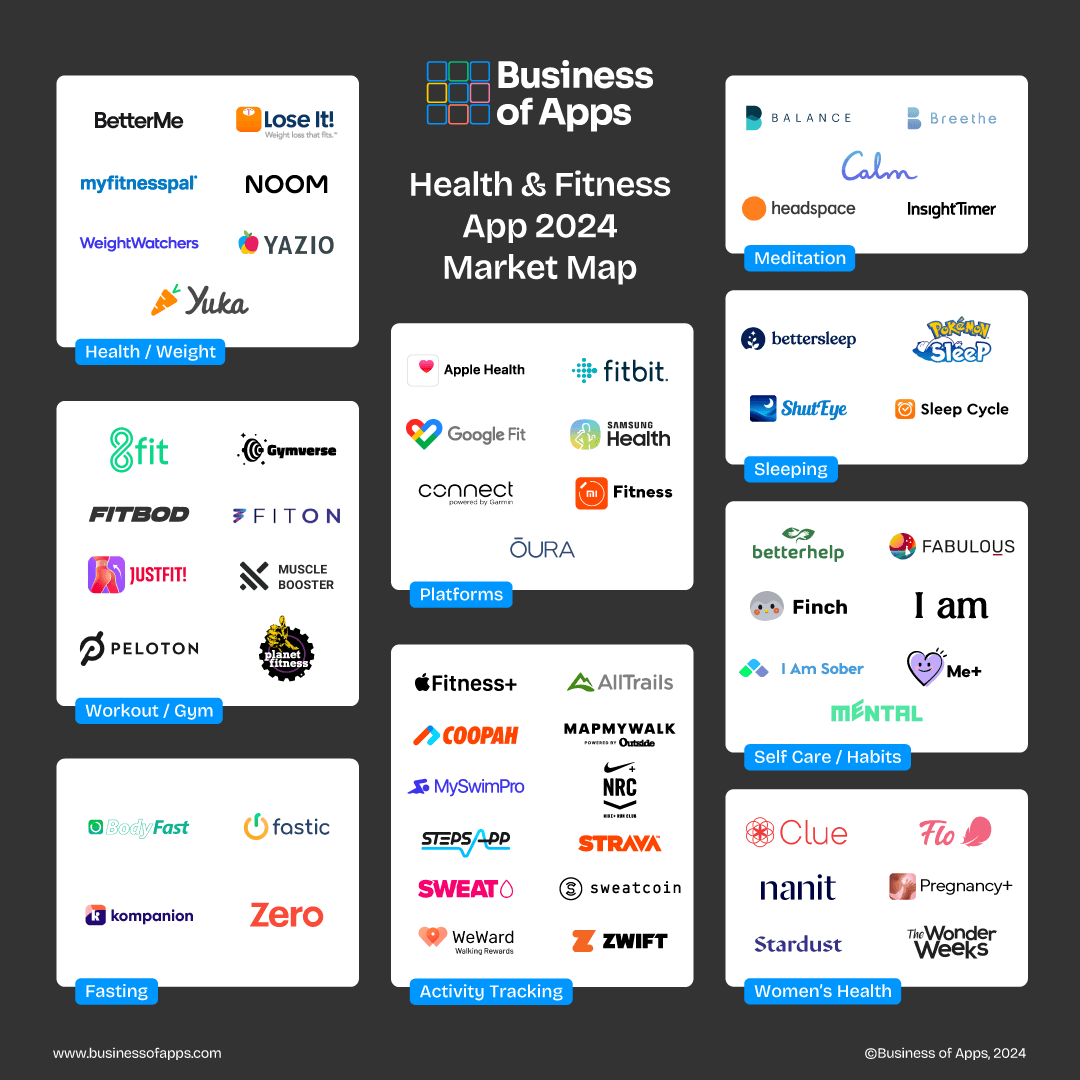
Health apps are part of a wider ecosystem of the health and fitness category. For health, platforms play a key role in tracking various metrics; activity tracking apps are available for targeted activities and exercise. There are also apps available for tracking food intake and weight, with coaching available to improve health and wellbeing. You can download this market map as a PDF, which includes a landscape version.
Health App Revenue
Revenue from health apps reached $3.74 billion in 2024, with total revenue increasing rapidly since the pandemic.
Health app revenue 2016 to 2024 ($bn)
Health Revenue by App
WeightWatchers generated the most revenue by app through its digital subscription service.
Health revenue by app 2024 ($mm)
Health App Usage
There were over 320 million people that used health apps in 2024.
Health app users 2015 to 2024 (mm)
Health App Market Share
MyFitnessPal is the most popular health app on both iOS and Android, with over 40% market share.
Health app market share 2024 (%)
Health App Downloads
There were 388 million downloads of health apps in 2024, an improvement on 2023.
Health app downloads 2018 to 2024 (mm)
More Health & Fitness App Data
- Strava Revenue and Usage Statistics (2025)
- Health & Fitness App Benchmarks (2025)
- Sweatcoin Revenue and Usage Statistics (2025)
- Wellness App Revenue and Usage Statistics (2025)
- Fitbit Revenue and Usage Statistics (2025)
- Calm Revenue and Usage Statistics (2024)
- Flo Revenue and Usage Statistics (2025)
- MyFitnessPal Revenue and Usage Statistics (2025)
- Headspace Revenue and Usage Statistics (2025)
- Fitness App Revenue and Usage Statistics (2025)


