SplitMetrics, a company specializing in app growth solutions, has released its annual Apple Search Ads Search Results Benchmark Report, which analyzed data from SplitMetrics Acquire and how Apple Search Ads search results campaigns performed throughout 2023.
Our latest data reveals that competition in the app marketing ecosystem is fierce, and downloads are plentiful. This is the perfect environment for smart, strategic app marketing to truly shine. Developers should take note that there is a large potential user base in countries outside Western markets that could be very cost-effective to secure.
Certain categories, such as Finance, are expensive and highly competitive battlegrounds. Here, meticulous planning and targeted strategies are crucial to maximizing return on investment. When app marketing works, it works wonders, but in this climate, budget and strategy are more vital than ever.
The main findings of the report were:
- Finance is the most expensive app category when it comes to acquiring new customers with an average Cost Per Acquisition of $8.57 — 107% higher than the average of $2.58 — while Music had the lowest CPA of $0.99
- Entertainment tops the list in terms of marketing effectiveness with average Tap-Through Rates (27.86%) and Conversion Rates (79.88%)
- Sweden, the United States and Canada are the most expensive countries to acquire new app customers with the highest average Cost Per Acquisition of $3.19, $3.00 and $2.55 respectively
- The USA is no longer a leader across all metrics and dropped out of the top 15 in Conversion Rates
- SplitMetrics report analyzed SplitMetrics Acquire data, covering the 15 largest App Store categories in 61 countries, 7.7m keywords, 2.54b impressions, 253.4m taps and 166.7m downloads
The period under review: January — December 2023.
A high TTR means that the app ad is relevant and engaging to the target audience – resulting in more people clicking on it to learn more. Whereas, the CR provides a clear measure of the effectiveness of a campaign’s total user acquisition efforts, including paid campaigns and organic traffic.
The most expensive categories to acquire new customers
Across all categories, the average CPA decreased to $2.58 in 2023 when compared to H2 2022 ($3.21). Finance is the most expensive category to acquire customers at $8.57 (CPA) although this has dropped by 27% from $11.34 in 2022.
SplitMetrics search results ads CPA by Category in Apple Search Ads
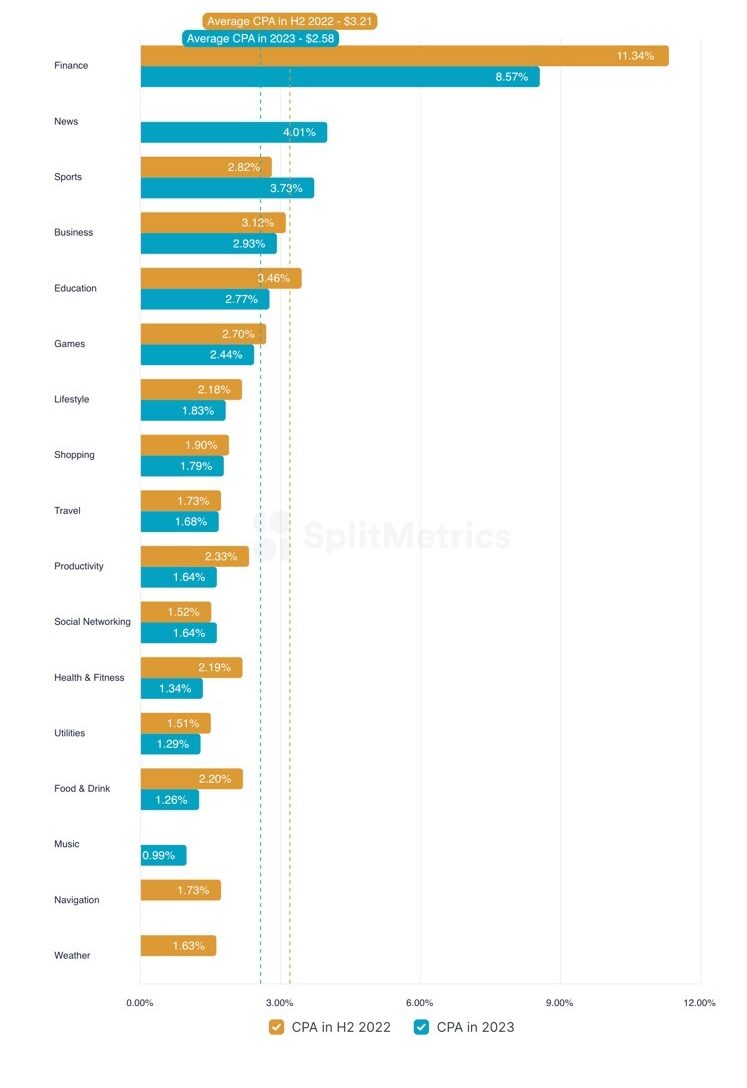
Source: SplitMetrics
Globally, Cost Per Acquisition (CPA) of users for the top 15 markets has risen 66% from $1.27 in 2022 to $2.11 in 2023. Looking at individual countries, Sweden ($3.19) is the most expensive country to acquire new customers, followed by the United States ($3.00) and Canada ($2.55). The lowest CPA countries in the top 15 markets are Hong Kong ($1.56), the Netherlands ($1.51) and Italy ($1.51).

Payments are silently stalling startup growth
High fees. Failed payments. Single point of failure. Our report shows why payments are holding startups back and how to fix it.
Download The ReportSplitMetrics’ search results ads CPA in Apple Search Ads by markets
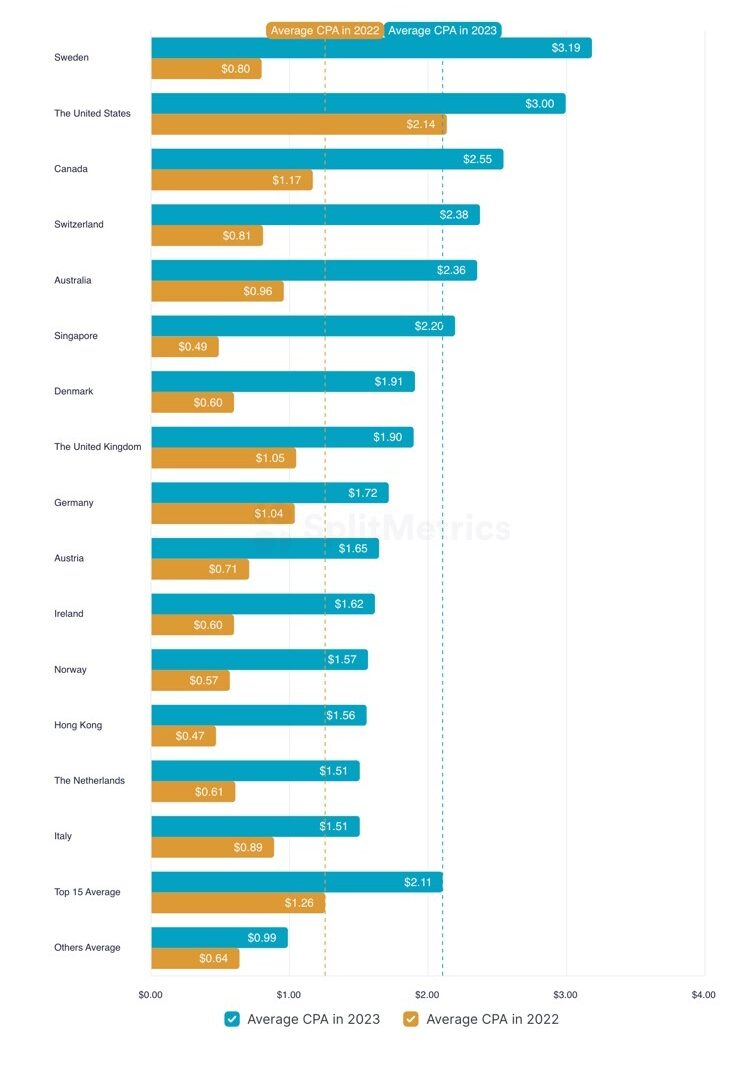
Source: SplitMetrics
The most effective app marketing categories
Across all categories Conversion Rates (CR)* are 65.37%, up 0.27% from 2022. The highest CR is Entertainment, which includes TV streaming, ticketing and radio apps, at 79.9%. Graphics and Design has the lowest CR at 59.61%.
Mexico has the highest CR at 72.39% followed by Chile with 70.38% and Ireland with 70.28%. The US has fallen out of the top 15 in 2023 following a drop of 0.26% CR to 65.85%.
Meanwhile, Photo & Video (69.61%) hitting the top three in terms of CR may point to the growing popularity of new GenAI-powered apps.
A key finding of the report is that the Entertainment category, which includes TV streaming, ticketing and radio apps, outperformed all other categories with a 27.86% Tap-Through Rate (TTR) — almost triple the average of 10.22%. This figure, combined with the CR, is a clear indicator that app marketing for Entertainment apps is highly effective. In contrast, Photo & Video, Travel, Education, Games and Shopping categories all had a TTR under the average of 10.22%, while Music, Social Networking, Utilities, Games, Productivity and Graphics & Design had a CR below the average of 63.5%.
There was also a wild card in the TTR findings — the Food & Drink category is in third place after Sports (20.46%) with a TTR of 12.64%, a big jump from 2022 when it was at the bottom of the list. Food & Drink is also in second place in terms of CR with 75.38% — a good sign of growth for the industry.
SplitMetrics search results ads CR by Category in Apple Search Ads
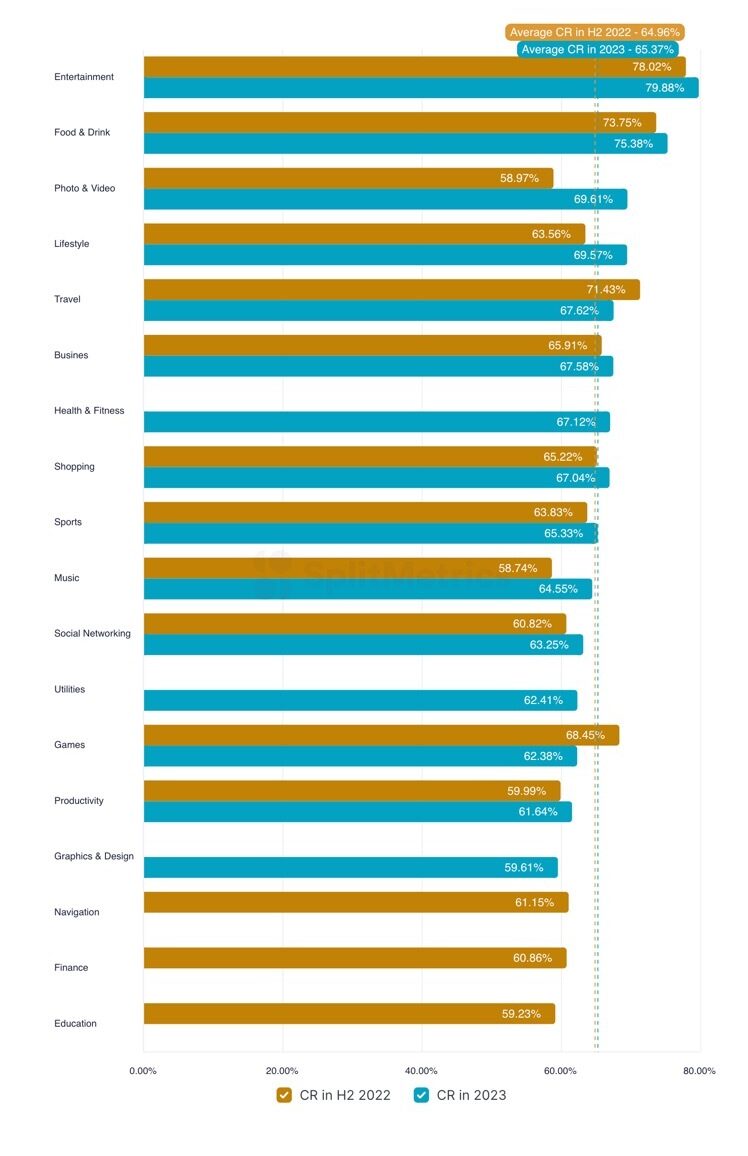
Source: SplitMetrics
The most competitive sectors for app marketers
The average Cost Per Tap (CPT) across all categories remained largely unchanged in 2023 when compared to 2022 at $1.59.
Despite experiencing a drop from 2022 ($6.54), the Finance category is heading the list once again as the most competitive category with an average CPT of $4.77 in 2023. This drop comes at the same time as downloads for finance apps are increasing (42% Y-O-Y) – suggesting that finance app marketers have refined their targeting strategies, allowing them to reach a more relevant audience at a lower cost.
Finance was followed by Sports ($2.43), News ($2.37), Business ($1.98) and Education ($1.62). Sports experienced the biggest growth (33%) when compared to the previous year ($2.07). News is a newcomer to the list having not made the top 15 last year.
The least competitive categories in terms of CPT rates were Health & Fitness ($0.90), Utilities ($0.81) and Music ($0.64).
Regionally, Sweden (CPT $2.04) climbed to the top and replaced the USA (CPT $1.97) as the most competitive market, while Canada ($1.68) ranked third. The least competitive markets were Portugal ($1.01), Spain ($1.00) and the Netherlands ($1.00).
Methodology
The report draws on internal data and industry insights to help mobile developers and marketers better understand current cost and performance trends in their niche.
The methodology is based on dividing specific quantitative data, such as spend, taps, impressions, downloads and installs, by a specific total, depending on the required indicator in accordance with the necessary type of information display: the App Store category or Apple Search Ads region.
SplitMetrics used the following formulas to calculate each of the key indicators:
CR = downloads / taps
TTR = taps / impressions
CPM = spend / (impressions / 1000)
CPT = spend / taps
CPA = spend / downloads
In this report, you’ll find the average TTR and CR, as well as CPT and CPA by categories and markets for the period of 2023. We also compared them with Apple Search Ads search results benchmarks from previous years, quarter-over-quarter. The benchmarks for the report were gathered with SplitMetrics Acquire – an AI & ML-driven platform for Apple Search Ads management, automation & optimization. SplitMetrics is an Apple Search Ads Partner.