2022 is coming on at full speed and we thought it’s the right time to go over the key metrics that you should be aware of and hopefully improve as you grow your app.
If you’ve looked at your app’s backend data you might feel lost as to what’s actually important. Having the right tools is critical to staying on top of the data so that you can create, revise, or – in some cases – abandon features and marketing efforts as needed.
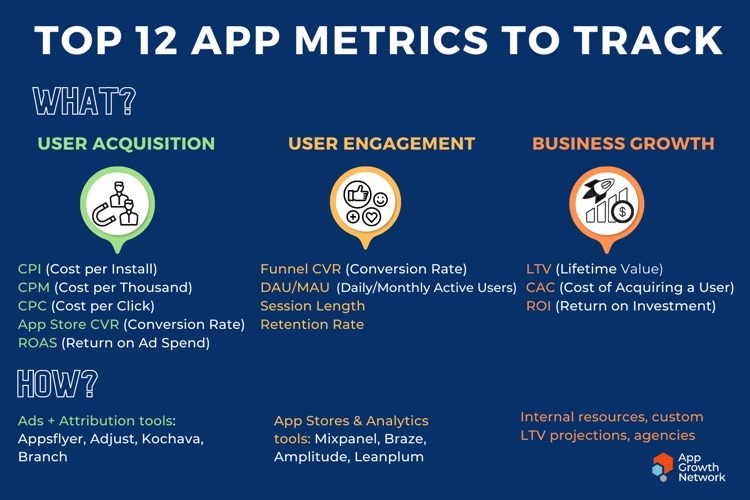
The most important app metrics – or Key Performance Indicators (KPIs) – to track can be categorized based on which part of the user journey you are evaluating. We have broken down key metrics by the 3 key areas of every app: User Acquisition, User Engagement and Business Growth.
User Acquisitions Metrics
Cost per Install (CPI)
CPI tells you how much it costs to acquire a new user from a paid ad. It’s calculated by dividing your ad spend over a specific period of time by the number of new installs made during that same time. CPI, for mobile apps, is often one of the only metrics that people pay attention to when they start running their campaigns.
It is a big misconception that the lower the CPI the better your paid user acquisition strategy is. Oftentimes, especially on Android global campaigns, you will be able to get very low CPI but these users coming in will barely convert to paying users or really engage with your app long term.
At AGN we promote a targeted approach using trusted ad networks, like Facebook Ads and Apple Search Ads to get interested users who are more intent on making purchases and/or staying in your app long term. This can of course lead to a higher CPI, but we can use the return on ad spend (ROAS) and the lifetime of the user (LTV) to accurately see if that CPI is worth it.
The benchmarks for CPI vary significantly depending on the type of app, industry, country, and ad platform. If you are wondering what your paid UA strategy should look like, feel free to reach out to our team!
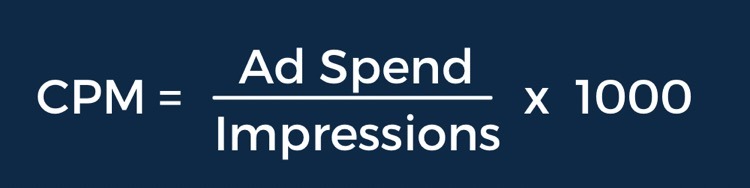
Cost per Thousand (CPM)
Cost per Mille (Thousand) is the cost of getting a thousand impressions on your ad and is often overlooked in an industry where a download and further user engagement plays a greater role in monetizing customers.
Despite this, tracking your CPM can give you lots of information. For example, you can compare it to your CPI and see how effective your ad is, maybe it’s very good at getting people to look at the ad but not to install the app, then you can adjust your creatives or your ASO listing to see if the conversion rate improves.
CPM is generally better for awareness campaigns or to promote brand recognition, as you just want to get your name out there and convey key features of your product. And in times when tracking can sometimes be limited, you can use CPM as the overarching pseudo metric to keep track of your campaigns’ effectiveness.

Cost per Click (CPC)
This metric tells you how much you pay per click on a paid aid. Keep in mind that your CPC rate varies greatly by ad platform, by device and even by ad placement. The CPC for an Instagram ad will be different from an ad served on a desktop feed, from an ad served on a mobile feed, etc.
If you’re running a PPC ad campaign, the goal is to increase the CTR (click-through rate) and to decrease your CPC.
App Store Conversion Rate
This is the percentage of users who download your app from the total number of users who visited your app store page. CVR varies based on the app category, app platform (iOS or Android), and country.
Monitoring the performance of your App Store page performance is a vital indicator for maintaining your ASO. Your App Store conversion rate will increase and get stronger the more you keep your page properly optimized and provide the best assets—like maintaining ASO keyword research optimization, optimizing screenshots, preview video, etc.
The average CVR in the US is 30.3% in the Apple App Store and33% in the Google Play Store – but this varies widely by category. For example, in the App Store, the highest average CVR was found in the Photo & Video category at a whopping 73.3% whereas average conversion rate dips as low as 5.1% for the Games (Board) category.
The graphs from AppTweak below show average CVR by category for the Apple App Store and Google Play:

Click to open the full-size version

Click to open the full-size version
ROAS (Return on Ad Spend)
ROAS measures the revenue you receive for every dollar spent on advertising — so basically how much profit you make from a specific ad campaign whether its Apple Search Ads, Facebook, etc.
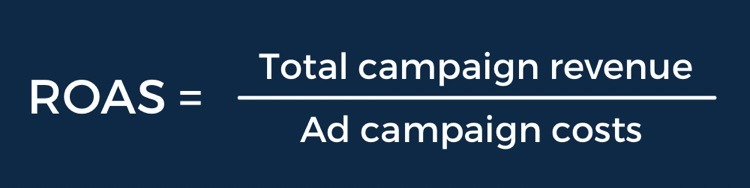
As mentioned previously, ROAS comes in clutch when you’re trying to justify your paid UA efforts and your current CPI values. It helps you plan ahead what your marketing budget should look like to achieve the goals set out by your business.
For more insights about UA, check out the App Growth Show podcast episode: 4 Steps to Supercharge User Acquisition
User Engagement Metrics
Funnel CVR
It’s important to track the funnel conversion rate for an app and engage with users where there is a drop-off at every stage of your app customer lifecycle funnel.
Here is an example of the typical user flow for an e-commerce app:
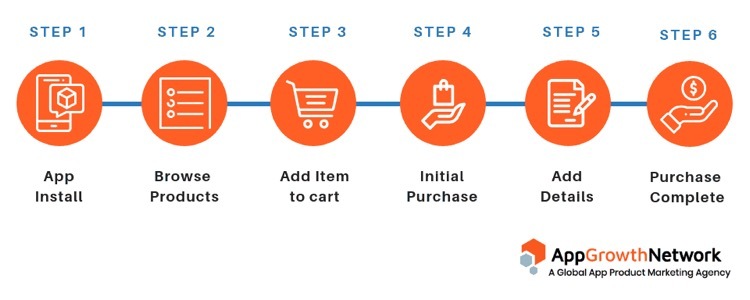
Check out the funnel points where users are dropping, analyze reasons for the drop-off, and make improvements in that step in order to increase your conversions.
Active Users (DAU & MAU)
Getting downloads is obviously important. But that’s just the first step. For a majority of apps, what’s equally (if not more) important is if those who have installed your app are using it.
And with stats indicating that apps lose an average of 75% of users within the 1st day of the app install, keeping users engaged is clearly a major hurdle. That’s why you want to track your DAU (Daily Active Users) and MAU (Monthly Active Users) mobile app metrics to give you a better understanding of how engaging your app is.
DAU shows the number of unique users that use the app daily, while MAU tells you the number of unique users that use your app over a 30-day period.
Depending on the type of app you have, DAU may be your most important KPI to track—like for social media apps, dating apps, or some health and fitness apps. But it’s important to keep in mind that not all types of apps need daily use to be valuable—such as travel apps or food & drink category apps.
It’s important to figure out how valuable this metric is in determining your sustainability and monetization goals in correspondence to the type of app category you’re in.
Session Length
Session length is the amount of time a user spends in your app. The time begins when the app is opened and ends when it is closed. The ideal session length for apps varies depending on the type of app.
Session length is an important metric to measure because it helps to determine whether the user is spending enough time on the app to trigger important action. For e-commerce, this action would be purchase; for travel, book a ticket; for meditation, completing a meditation session; for content, reading & sharing content.
If a session length is not long enough, that means there’s a problem that needs to be solved.
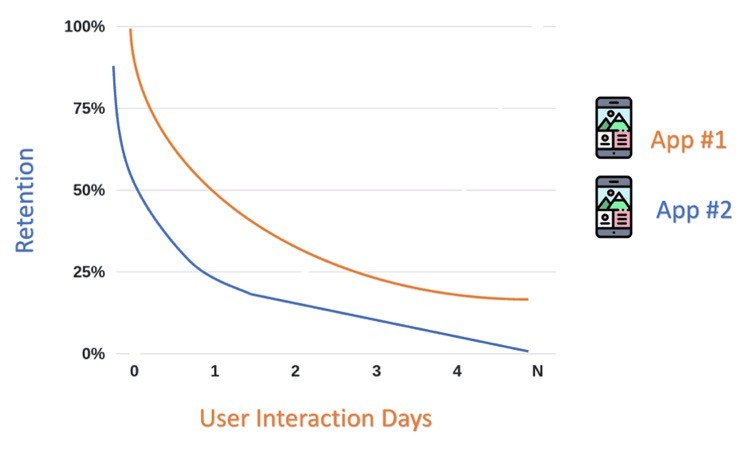
Retention Rate
This is the most important metric for apps. Even in our expert interviews, all mobile app veterans specify this as a must-measure KPI.
There can be different types of retention:
- N-day retention – users are active on a particular day after installing the app. It is the same as classic retention.
- Unbounded retention – Users are active on a particular day or after that day. Sometimes also referred to as rolling retention.
- Bracket retention – users are active within a particular time period.
Based on the app type, you should select which retention to follow. For a gaming app, N-day retention is relevant – while for a movie booking or travel app, unbounded retention is more relevant.
This is what typical retention curves look like – for app #1 retention is clearly higher. Mobile app developers should always aim to move the retention curve up for overall app success.
For more insights about user engagement, check out the App Growth Show podcast episode: Maximizing Conversion Rates Through In-app Experiences
Business Growth Metrics
10.Lifetime Value (LTV)
The lifetime value is just that—in this case it’s the average user monetization over the whole time that they spend interacting with your app. This metric can be tricky to calculate depending on your business model, but is essential to understanding what kind of users you’re bringing in and whether your business model is sustainable.
If we think about it formulaically, we can get to the fact that:
LTV – avg $ per purchase * avg # of users annually * # of years users use app
But often you might not have access to all three of these metrics, maybe your app is in early stages, etc. So we recommend a different metric to give you an estimate.

Cost of Customer Acquisition (CAC)
Unlike CPI, CAC focuses on defining the costs associated with the acquisition of a paying user. It can also include in itself the other costs outside of just paid user acquisition. For example, you could categorize your website’s hosting fees and your graphic designer wages as essential to acquiring new customers and thus include it in the calculation.
CAC can be a flexible formula and it’s very important to define your version of it for your business and stick with it. If you decide to keep switching between different versions, it might be hard to keep track of the actual progress being made.
ROI (or LTV:CAC Ratio)
For an app to be profitable, the LTV:CAC ratio—aka your return on investment (ROI)—should be greater than 1 to just cover the cost of your marketing spend. Ideally you want to aim for a ROI of 3, so you have enough revenue to invest back into the business and keep it growing.
For more insights about app business growth, check out the App Growth Show podcast episode: Creating a Growth Plan for Your Mobile App
Summary
There are many mobile app metrics that you can keep track of – some are more important to certain types of apps than others. Be sure to evaluate closely what makes the most sense for your particular app and that you have the proper measurement tools in place.
In general, the most important app metrics to measure fall into 3 categories: User Acquisition, User Engagement and Business Growth. They all play a different role in the insights they’ll provide into the user funnel, but they all ultimately work together to accomplish the same goal – to help you evaluate, revise and improve your efforts to have the most successful app possible.
Create a customized dashboard to get actionable insights by tracking all your app KPI’s in one place. Get in touch with the App Growth Network team for help & setup!