
App usage and engagement metrics can help brands and marketers understand their consumers’ entertainment, lifestyle, media and purchasing habits. But these metrics need to go beyond superficial data and show the detailed app choices people are making when it comes to time spent on their mobile devices. With legislation, privacy concerns, and ecosystem restrictions becoming increasingly stringent, obtaining this data can be harder than ever.
What are the number of apps people use on a weekly basis?
But you still need to know how your app is really measuring up – beyond the number of downloads. Using our proprietary Retro methodology, which facilitates the sharing of account-level data, we found that individuals aged 16-25 spent nearly 45 hours on their iPhones on a weekly basis. With our focus being on engagement, our data also shows that individuals are only actively engaging with 42 apps per week, indicating that the stickiness of new apps may be relatively low. So while downloads can be into the billions, an average user only has a handful of apps on their phone, and the number of apps they engage with regularly is even smaller.
Where does Gen Z prefer to shop?
Having access to mobile and account-level data can show you much more about your audience than you may realize. You can not only see how your audience is interacting and engaging with your app, but you can see which other apps are taking up their attention and time. For example, our recent App Life Report showed that while the Apple App Store and Amazon app still dominate the shopping scene, SHEIN continues to establish itself with nearly 28% of individuals ages 16-25 using it on a weekly basis – 1.9 times more than the average listed shopping app. This warrants closer examination by competitors who don’t want to lose the Gen Z market share to this increasingly popular shopping app.
Women are breaking gaming gender barriers.
If women are a core part of your audience, then some of their surprising mobile behaviors should be taken into consideration. While TikTok dominates several categories when it comes to engagement, it is even more profound for women. We found that while TikTok is used by 67% of users aged 16+ for approximately 9.8 hours per week, 81.6% of women aged 16-25 engage with the platform even more extensively, clocking in at 12.6 hours per week.
Gaming is a whole other story, as game apps are breaking down the gender barriers, with women gamers ages 16-25 playing Roblox about 4.7 hours on their iPhones weekly. This compares to 3.3 hours for men ages 16-25, indicating the popularity and growth of iPhone devices for gaming among women.
When we layer this gaming insight with other data that shows how much people are spending on purchases inside gaming apps (more than $17 monthly), we have some powerful reasons to look again at women in the gaming space and market to them appropriately. In fact, our data shows that, based on total in-app spend, 14 of the top 15 vendors (excluding subscriptions) were gaming publishers.
Engagement is more than just eyeballs and downloads.
While many app developers may be apt to congratulate themselves on the number of downloads alone, it is clear that we need more information and data to really understand the success of any singular app – particularly amongst its competitors. It is critical to understand active engagement with an app, as well as insights into what other apps audience members or potential audience members are using.
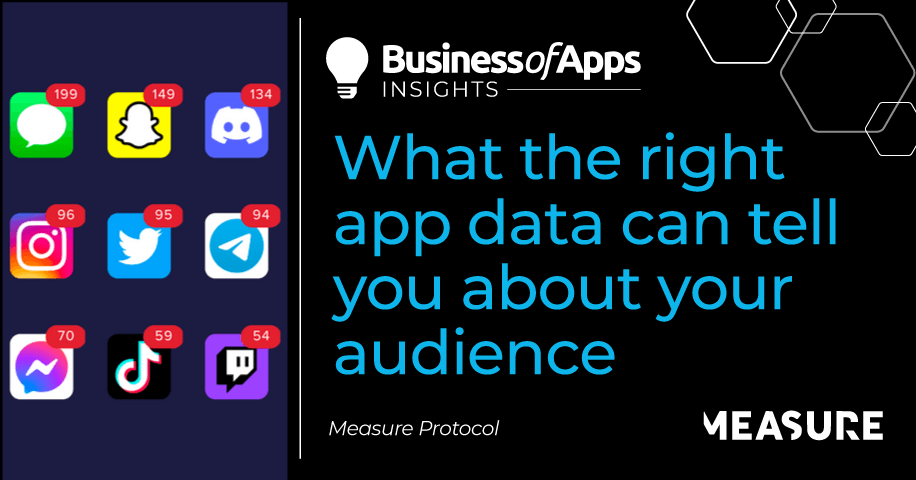
Another key metric that speaks to engagement surrounds notifications. Are your messages getting through or are they being silenced by users? Our data found that community-based gaming and messaging apps are still leading the pack when it comes to average weekly notifications: Messages (199), Snapchat (149) and Discord (134) are out front. Interesting up-and-comers to monitor include Telegram (94), and Twitch (54).
Just to add one more layer to the engagement metric, it is also important to examine what we call “purposeful” or “priority” engagement. Purposeful engagement can be gleaned by looking at which app individuals first use when they pick up their phone. We found that among the 16-25 age group, Snapchat was far and away the leader here – it was the first-used app 118 times per week. Among the 26+ crowd, Messages led the app pack at 119 times per week.

Music tastes vary as much as audiences do.
Did you know males are more likely to use Amazon Music than women, and women are more likely to use Spotify or YouTube Music than men? These are just some of the types of insights you can glean from the right behavioral data. We took a closer look at listening habits and found that men spend approximately 33 hours (every 30 days) streaming audio content via the Musi app, whereas women are spending about 30 hours on Spotify. A majority (more than 85%) of audio content is being consumed passively – in the background – as opposed to on-screen on the iOS platform.
Why is this important? Audio is rising again as a lucrative vehicle for capturing audience attention. In fact, a recent study by Audacy found that audio listeners plan their days around their audio listening with three-quarters (74%) of listeners surveyed consuming audio during their “daily rituals” and 40% of listeners planning their day and activities around audio content. Deeply understanding things like audio consumption and behaviors when it comes to music apps can help brands better reach audiences, and plan media spends.
Where to find your hidden behavioral data?
With an increasingly fragmented media and digital life landscape, understanding how individuals engage with their devices, apps, services and media has become ever more challenging. Brands are turning toward hidden behavioral data and trends to gain a competitive edge and better engage with their customers and supporters.