


Google Play has announced monitoring and configuration changes to store listing experiments to help developers have more control over A/B tests. ASO practitioners need to stay up to date with these new features and understand what the changes mean. Here, our team at Phiture previews these changes to Google Play experiments and provides a technical deep dive into the statistics to explain why they have already been so well received by the ASO community.
An overview of the new features
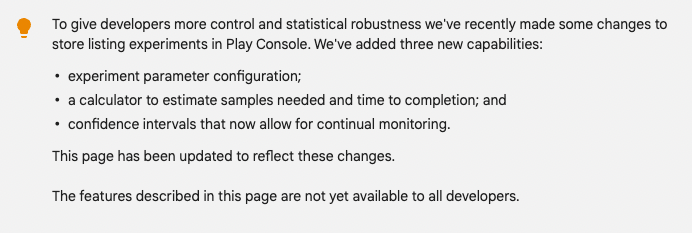
There are three new features for store listing experiments: experiment parameter configuration, sample size calculator and test duration, and confidence intervals that allow for continual monitoring. This is exciting news for ASO practitioners and has been well received.
A list of new features for store listing experiments
Source: Google Play Console
ASO practitioners will no longer need third-party sample size and test duration calculators. A new parameter configuration will bring more reliable test results based on the confidence interval and minimum detectable effect. Furthermore, the possibility to customize the experiment settings is to help calculate the sample size and time of completion.
Source: Play Console Help
A/B testing methodology relies on statistical analysis and statistical analysis relies on calculating probabilities. The main goal of the statistics behind experiments is to decrease the possibility of errors and enhance the likelihood of the test result being a true positive. MDE, confidence level, and statistical power then come into play.
MDE, confidence level and statistical power explained
The Phiture team connects the dots between statistics and store listing experiments to help ASO practitioners understand what lies behind A/B test results. Here Phiture Data Analyst Wynona Wong and ASO Consultant Milica Kostic give an overview of how we do this, as well as illustrate the importance of the changes to Google Play experiments, by deep diving into MDE (minimum detectable effect), statistical power, and confidence intervals.
Introduction of hypothesis testing
Hypothesis testing is used to assess the credibility of a hypothesis by using sample data. A hypothesis test includes two hypotheses: the null hypothesis and the alternative hypothesis. The null hypothesis is a statement to be tested, where the alternative hypothesis proposes that there is a difference. All in all, hypothesis testing provides a method to reject a null hypothesis within a certain confidence level.
We want to make sure that the difference between version A and version B occurs due to changes we made and not by chance. To prove that, statisticians use the null hypothesis. In hypothesis testing, in general, we would like to reject the null hypothesis correctly. For this purpose, we need a significance level which is the probability of seeing a false performance of a variant. To minimize the occurrence of deceptive tests, an acceptable level of detection risks should be up to 10% (which gives a minimum recommended confidence level of 90%).
For example, if we have a 90% confidence level in a store listing experiment, the significance level is 10%. We can claim that we are 90% sure that we reject the Null Hypothesis correctly. This further implies that we are 90% confident that variant B is better in performance because of our work on test assets and not by coincidence.
Confidence Level
There is an important distinction between confidence level and confidence interval. A confidence level states to what extent you are confident that the test result will be the same if you repeat the test. The confidence level value is expressed as a percentage (e.g. a 90% confidence level). Alternatively, significance level is sometimes mentioned when doing hypothesis testing, it is equal to 1 minus the confidence level. For example, if the confidence level is 90%, the significance level would be 10%.

A confidence interval is a range of results in which we expect the true value to appear. For example, a 90% confidence interval is the range of values you can be 90% certain of that contains the true mean.
In a perfect universe, the confidence level is 100%. In reality, it is usually set to 90%-95% in most cases in A/B tests. How can we reject the null hypothesis correctly based on Phiture’s team experience?
First, conclude the test once the confidence level is high enough, ideally 95%. Make sure to run tests long enough and reach a good sample size. Otherwise, the test results might not meet the credibility expectations. With Google Play Experiments’ new features, we will soon have a sample size calculator and test duration calculator which will help to minimize the possibility of errors.
Power
Power is the probability of making a correct decision to reject the null hypothesis, when it is indeed false. When achieving a higher power, one can conclude that the null hypothesis is false with a higher accuracy.
On the other hand, when an experiment is underpowered, what usually happens is that we fail to reject the null hypothesis, when it is actually false. That is to say, the variant could have been a winner! The underpowered result further leads us to stop the experiment and abandon the hypothesis and the CRO roadmap, as we end up with a conclusion that the variant shows had no significant impact on the conversion rate. How can we avoid this error and make sure we don’t get false-negative results?
First, increase the sample size. The test result will be more reliable if it is performed on 15000 users compared to 500 users, right? Second, decrease the number of variants. Ideally you would have one control variant+one test variant. You can also consider A/B/B tests, which from our experience, minimize the chances of false positive or negative results.
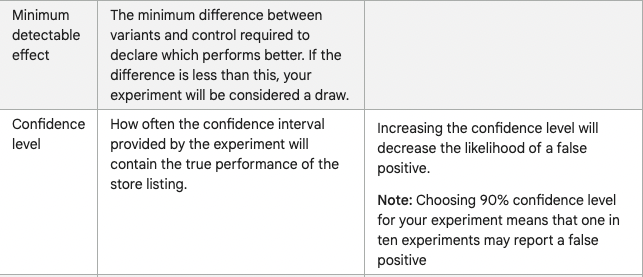
Minimum Detectable Effect
In an experiment, MDE is the smallest relative change in the conversion rate that you are interested in detecting, in other words, this is an assumption of the uplift of the conversion rate between the control version and variant group in the test. For example, if the baseline conversion rate is 20%, and the MDE is set to 10%, the test would detect any changes that move the conversion rate outside the absolute range, which in our example, is between 18% and 22% ( a 10% relative change is a 2% absolute change in conversion rate). Apart from that, the smaller the MDE is, a larger sample size is required to reach significance. This is because more data is needed to detect a smaller change in the conversion rate between the control group and the variant group. What’s more, the baseline conversion rate also plays an important part in calculating the sample size. For instance, if the baseline conversion rate is 30%, you do not require as large a sample size as if the baseline conversion rate is 1%.
Number of variants, sample size and test duration
Equal audience distribution when doing A/B tests matters because the data tends to behave in a known way. For non-equal splits of audience/sample size, all calculations such as uplift, conversion, and similar need to be calculated with scaled installers.
Time is money in A/B testing and we want to get the test results as soon as we can (ideally 7-14 days). We also want our test to be positive. Therefore, we want to focus on planning, setting goals, creating a strong hypothesis, and evaluating app or game metrics before even starting an experiment. Factors that largely affect the process of experimentation are number of daily visitors, sample size, baseline conversion rate and number of variants that we want to test. All these factors affect the test duration.
We are all familiar with web-based sample size or test duration calculators. However, they have proved unreliable in practice when it comes to A/B testing. Why? Because different calculators differ in their underlying statistics and they all lack some features, e.g. Evan Miller’s sample size calculator calculates the sample size but not the duration. The VWO’s test duration calculator does not calculate the sample size. On top of that, there is a discrepancy in test estimations between the two and they have proved to be inconsistent predictors of sample size or test duration for Google Play experiments in our experience. Google Play is adding these features in the console and moving forwards ASO practitioners will be better able to predict the experiment outcomes, however it is still important to have an understanding of web-based calculators and their potential pitfalls.
Pitfalls of online calculators
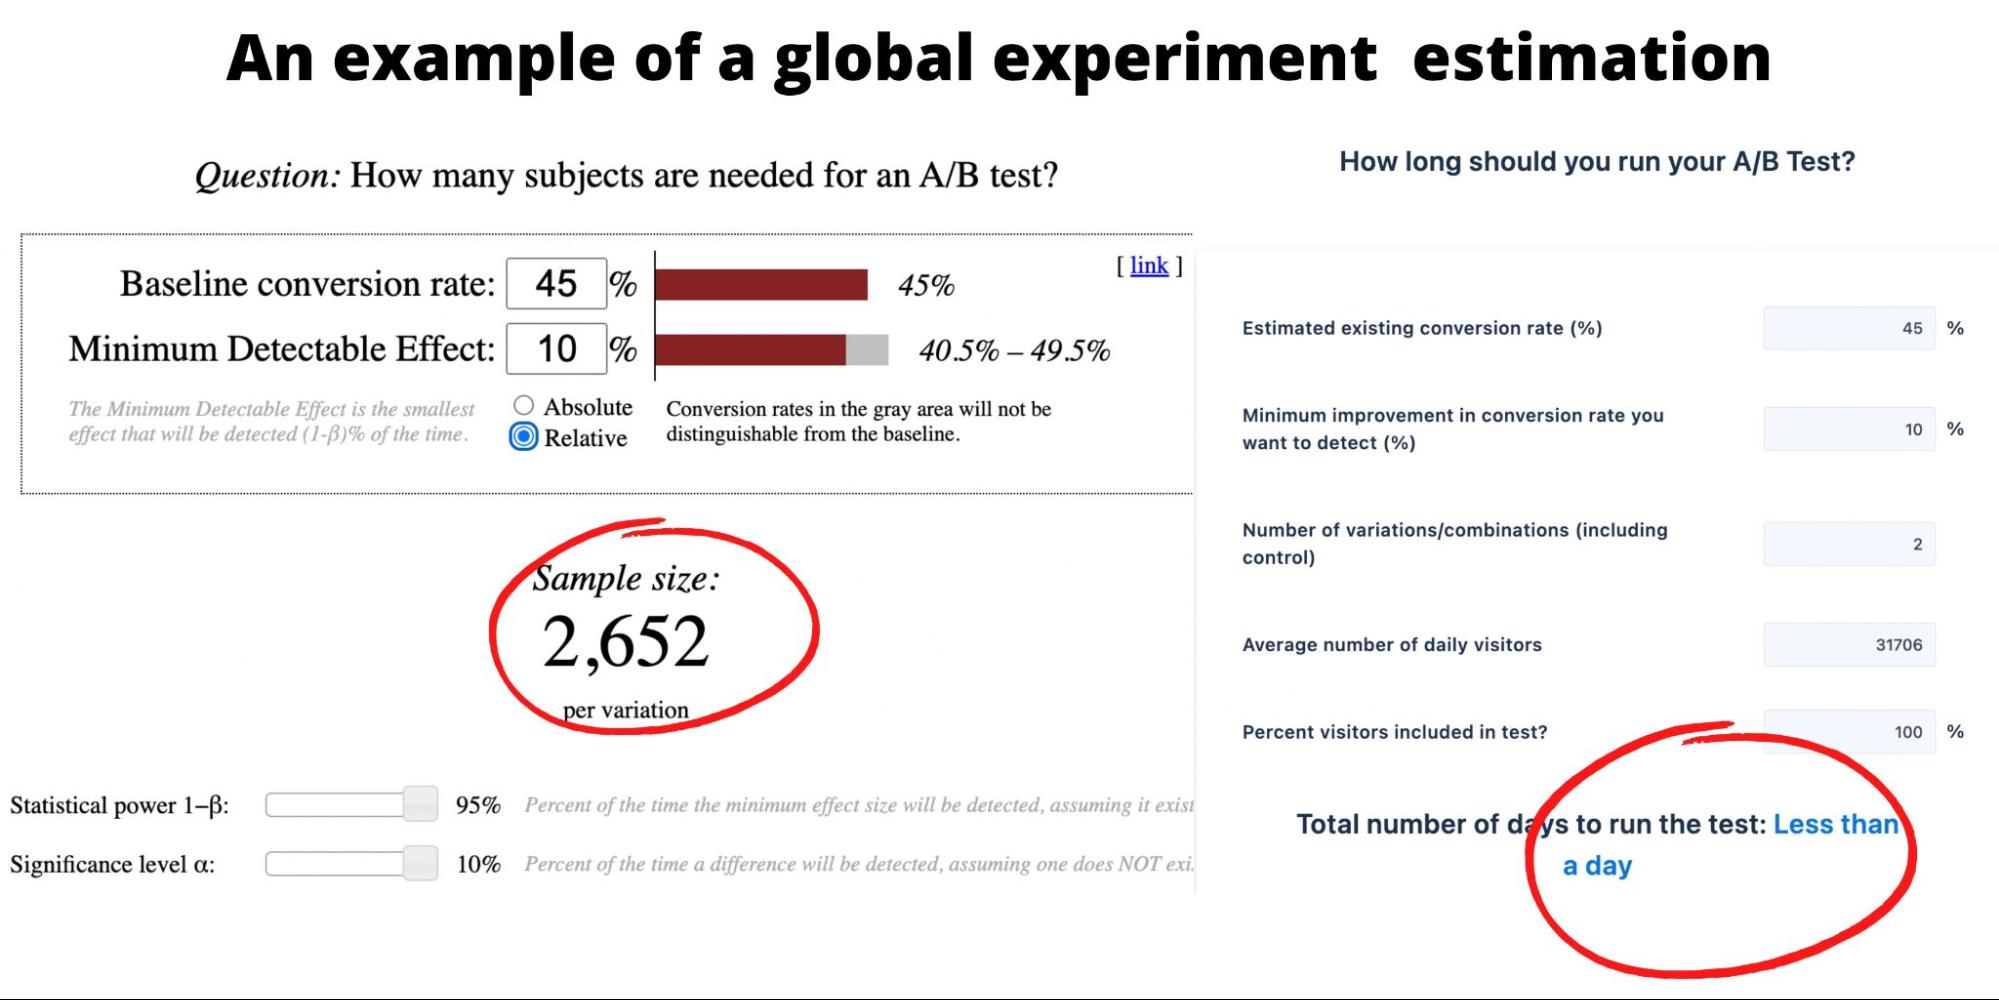
In the example below you can see an estimation for a default experiment with a 45% baseline conversion rate. As per Evan Miller’s sample size calculator, more than 2.5K in the sample size per variant is needed. VWO’s calculator predicts the test to last less than one day depending on a large number of average daily visitors per x period. Depending on the test and many other factors, this test can last 3, 5, 7 or 14 days, regardless of the daily visitors and conversion rate. In the past, it happened that this type of test needed about 10 days to finish and give reliable results. Besides, it happened that the test provides the final results within a few days with a smaller sample size per variant.
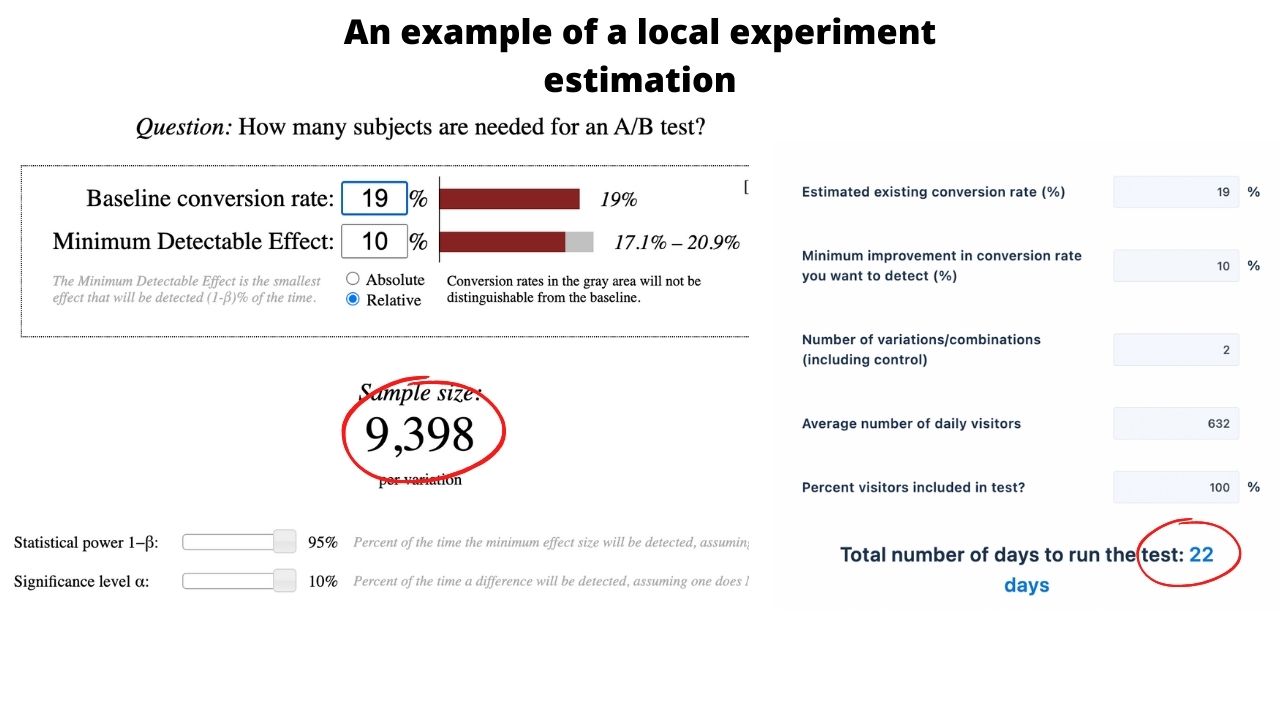
When testing locally, if the conversion rate for the market is low and there are not enough daily visitors, the test will last longer or continue “needing more data” for an infinite period of time. Let’s say we have a 19% conversion rate for a certain country and about 600 average daily visitors. As per the calculators, we are going to need more than 9K users per variant and 22 days for the test to finish. This test would be very problematic, right? Not necessarily. While it is important to have a good conversion rate and high number of visitors when testing, sometimes you might be surprised. What happened to us several times is that even with about 20% conversion rate and 1K daily visitors, the experiments were able to give results in 14 days or so. The trick is to carefully plan test assets and provide your audience with a value in the new assets.
Testing a large difference in graphical elements instead of making minor changes in certain elements also helps. If the paid campaigns are active for the market you want to A/B test, you probably want to use the uplift in audience and analyze the organic uplift when measuring the results. To conclude, you will not need 22 days to conclude this type of experiment and you can make an impact on the conversion rate by doing the right tests. It does not mean that you should test each and every country but if your target market needs improvement, you definitely want to give it a try.
How many average daily visitors are you going to need for a desired test duration?
The number of users who visit your play store definitely has an impact on the test duration. In the examples from the VWO’s test duration calculator you can see how long the test is estimated to run based on the number of visitors.
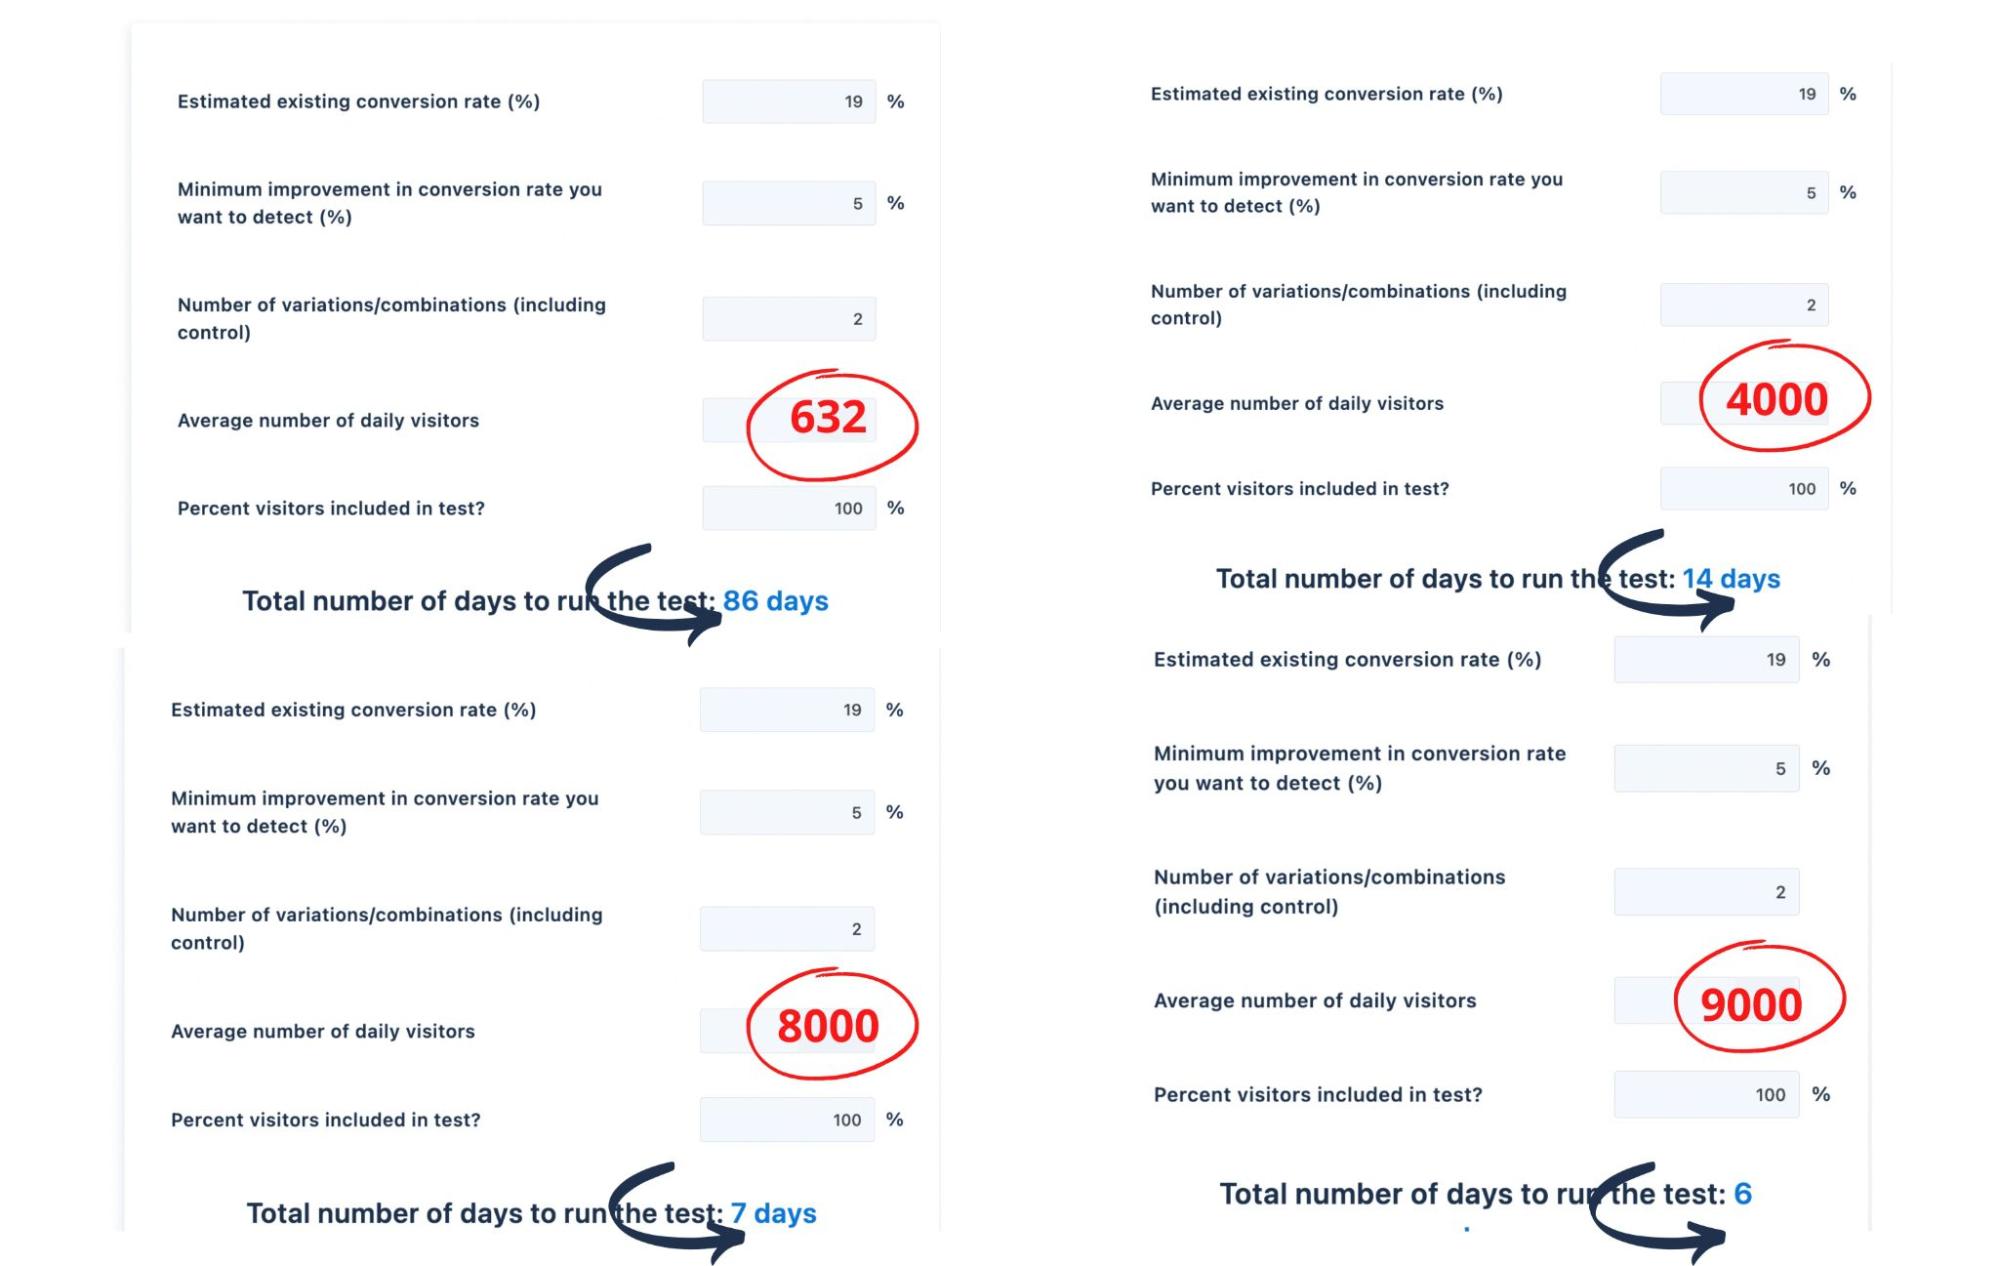
Depending on how many daily visitors the market you want to test has, test duration drastically changes. The larger the sample size, the shorter the duration. The main pitfalls of the web-based calculators are that the estimated duration and actual duration very often differ. For example, an experiment can be concluded with 1K installs for two variants in total. However, will this test result be reliable? The larger the sample size, the more reliable the result. Therefore, even if the test is done, you might want to wait a few more days to confirm the results. What happened to us is that the test is done and we have a winner. However, we decided to wait a few more days. The test then returned to “needs more data”. Afterwards, the result was totally the opposite. Even though the sample size has a smaller volume, the experiment didn’t last for 60 or 86 days and we were able to do a reverse test and confirm the results. The lesson is you don’t always need a huge sample size to get the results in a timely manner.
How does the number of variants affect the test duration?
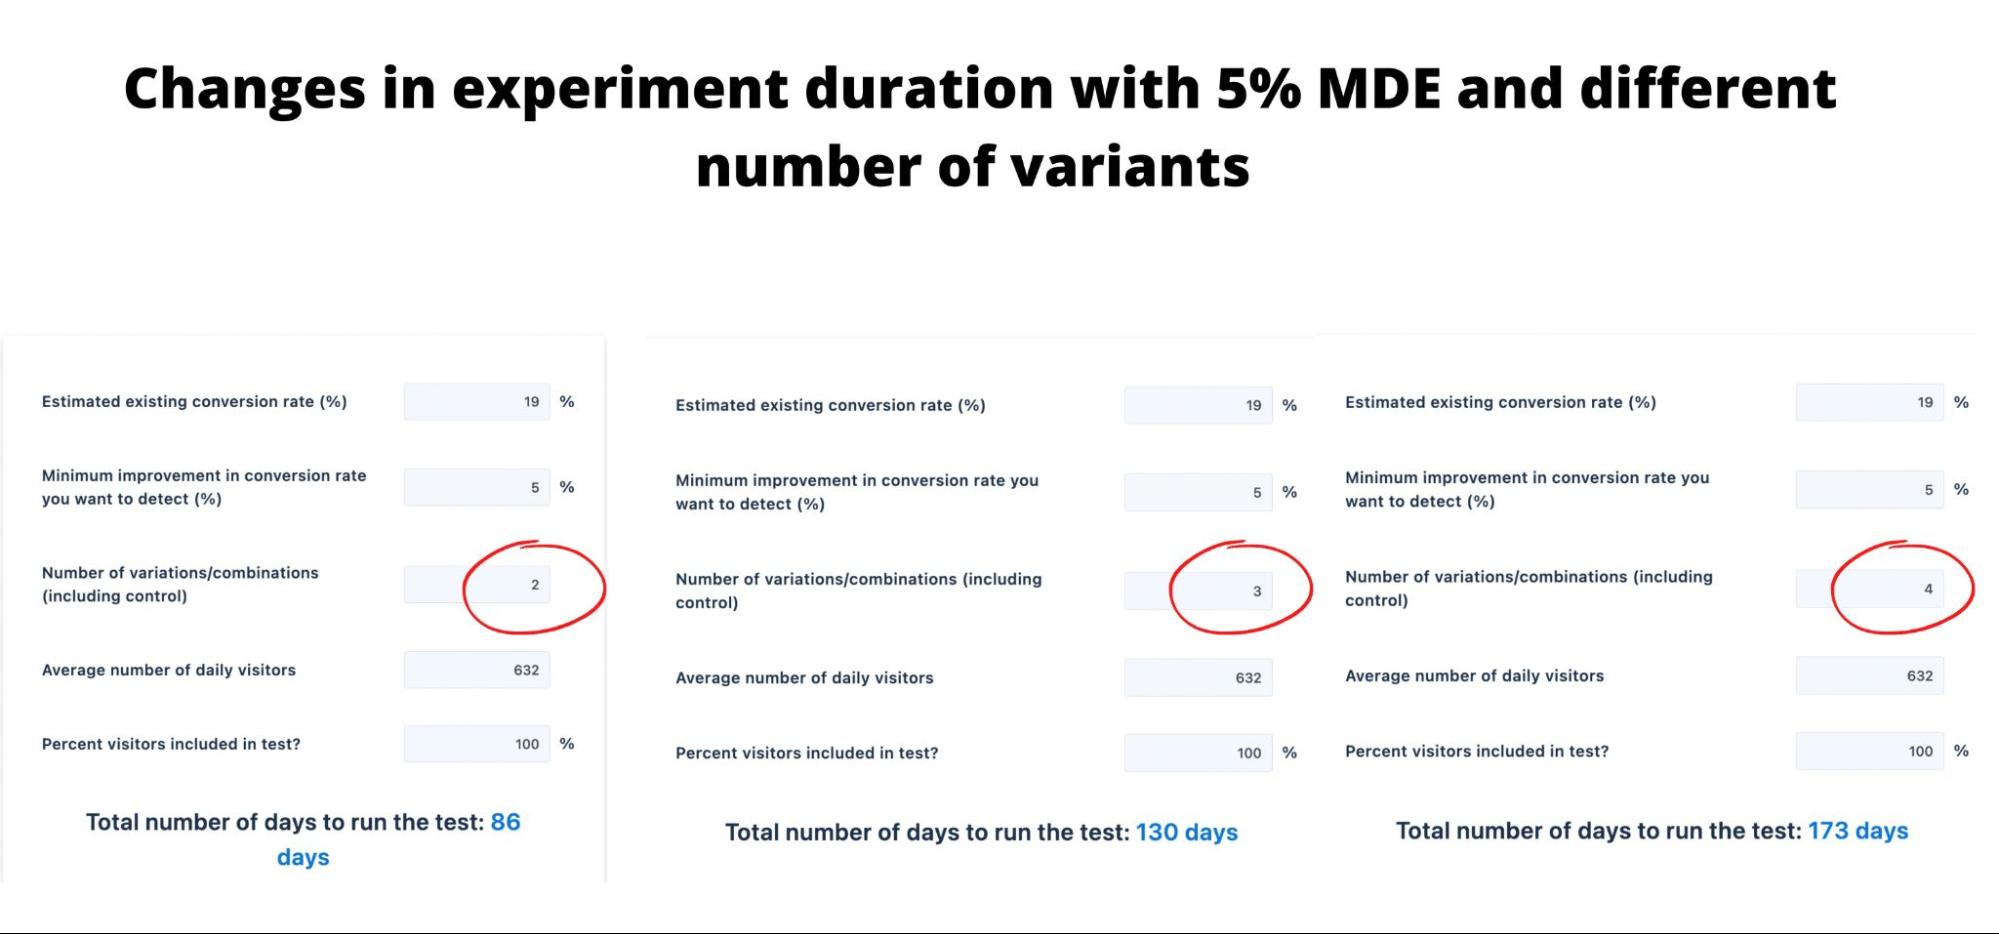
We have explained above how important MDE is and how it can affect the experiment. In the examples below you can see how 5% MDE and 10% MDE affect the test duration for two, three and four variants as per VWO’s test duration calculator.
The first image confirms two things:
- Small MDE extends the test duration
- A test with more than 2 variants (including control and test variant ) with a small MDE extends the duration even more.
If we now compare it with the 10% MDE, the difference in test duration is enormous.
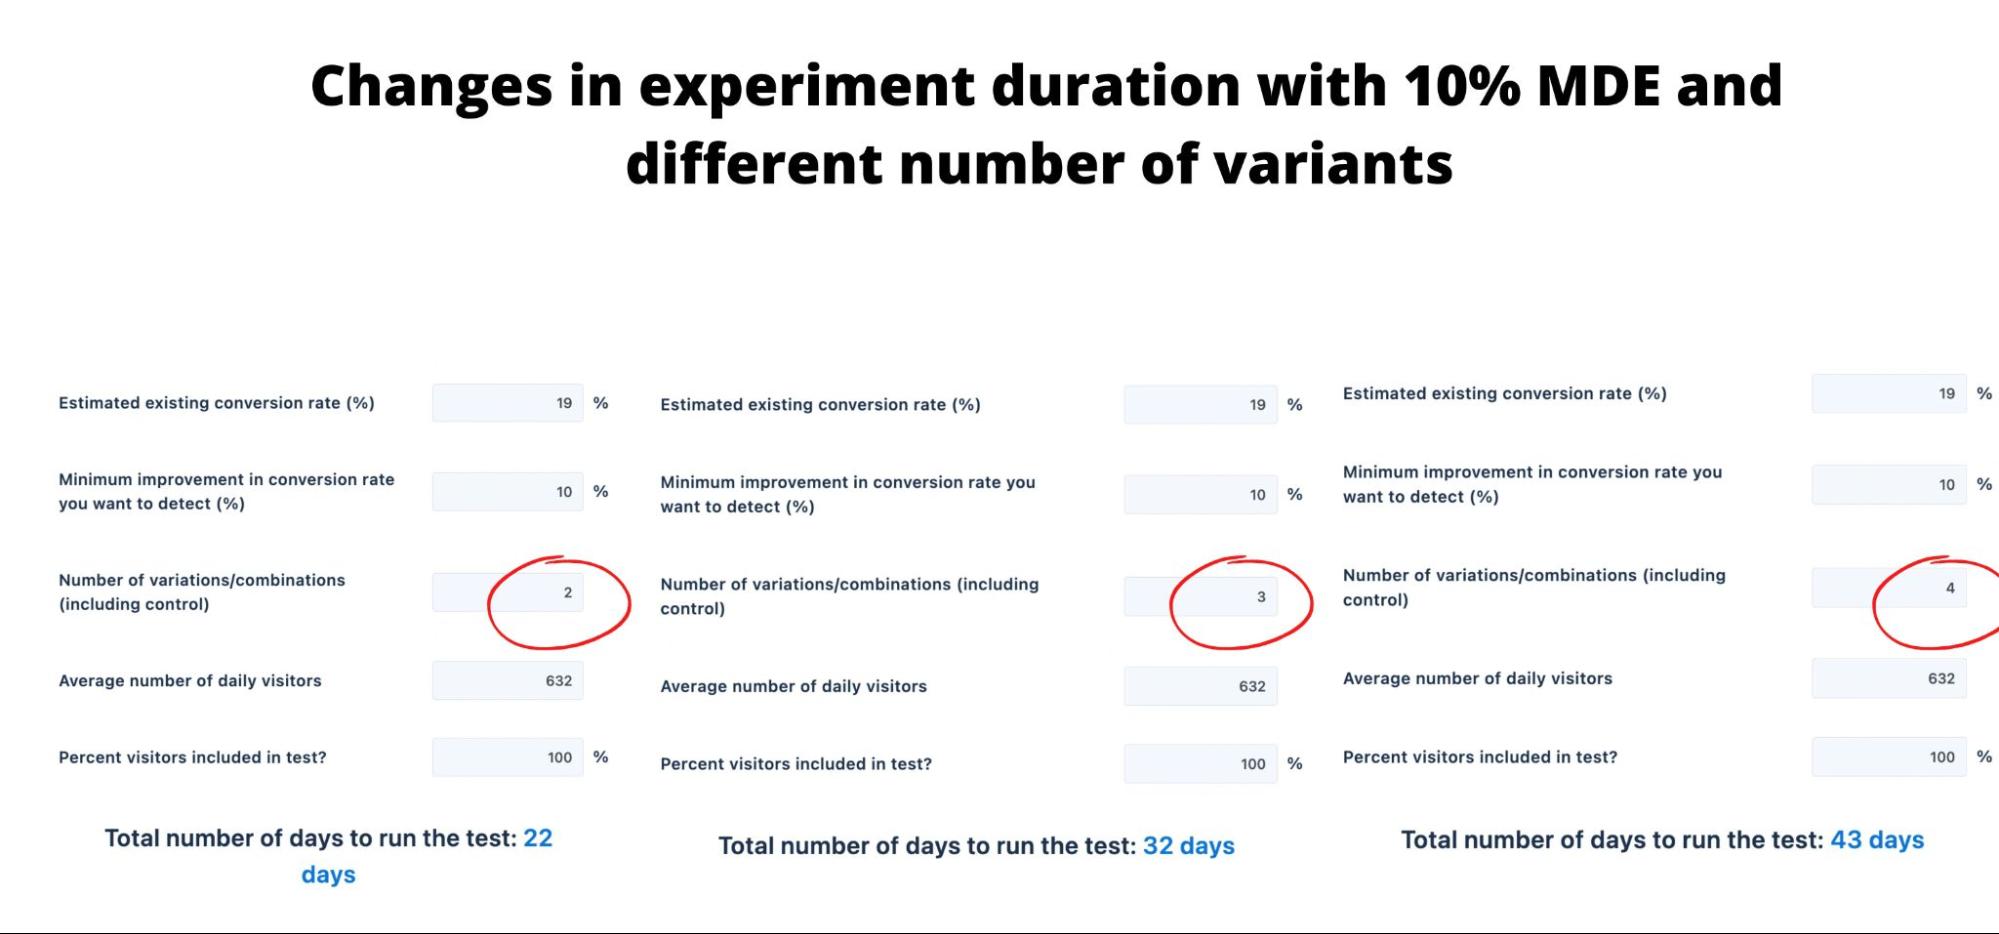
In practice, A/B tests and A/B/B tests provide results approximately within the same time, given a large enough volume of traffic. However, testing four variants (one control and three test variants) may prolong the test duration. If we put duration aside for a moment and think about the validity and reliability of the test only, testing only one test variant against the control variant gives the most reliable and valid results. Given that A/B/B test provides more control over the false positive and false negative results, it is also reliable and valid. Testing three test variants for any graphic element lasts much longer, it is not reliable, and may turn out to be invalid. From our experience, both A/B and A/B/B tests are safe. A/B/C tests should be done after the product launch or in the soft-launch stage to determine what resonates the most with your audience. In A/B/C tests, larger elements or concepts should be tested. A/B/C/D tests are tricky and should be done at the beginning for determining the concepts we want to go with. In general these tests should be undertaken less often.
What are the best combinations of these metrics to get valid experiment results?
Google added these new options in order to give us more flexibility when designing an experiment, in order to have a more precise A/B testing result. In general, best practice is to understand the current app performance and find the best combination of the metrics. The following are things to consider when creating a store listing experiment:
- Power and confidence level: many will suggest using a power level of 80% and a confidence level higher than 90%.
- Baseline conversion rate: a larger sample size is needed when the baseline conversion rate is smaller.
- Minimum detectable effect: it is the desired uplift of the conversion rate between the control and variant group.
- Sample size: a larger sample size is needed when testing more variants, though this will lengthen the test duration.
Conclusion
As Google Play is changing store listing experiments by adding three new features, we are all looking forward to seeing how it will look like in practice. It is important to understand the purpose of these changes before they come into effect. In order to have a better understanding of the upcoming changes, we wanted to share insights on how to combine Phiture team’s experience and these new updates in order to improve the accuracy of testing results. We also provided a technical overview of the statistics behind the experiments. We are confident that monitoring and configuration changes in Google Play experiments will help ASO practitioners run more effective A/B tests and provide flexibility to reach better results.
Key takeaways
What should ASO practitioners change in their approach and what should they focus on when A/B testing? Here’s a list of our recommendations.
- Have a strong hypothesis, plan your tests wisely and be mindful about the number of daily visitors and baseline conversion rate as they affect the test duration.
- Provide value in the test variants and focus on testing a large difference in graphical elements instead of making minor changes in certain elements.
- Focus on the markets that have a higher conversion rate first because tests will need a larger sample size and last longer when the conversion rate is low. For the target markets that do not have a large sample size, use the uplift in audience from the paid campaigns, if any, but make sure that the audience volume is stable during the experiment.
- Set a large enough sample size equally split per variant, with a power level of 80%, confidence level higher than 90%, and run tests long enough (at least 7 days). However, If the experiment results are off in the first 3 days, stop the experiment to avoid a conversion rate drop and move on to the next.
- Decrease the number of variants (A/B or A/B/B test recommended). Check the results by performing a B/A test and measure the conversion rate change after you apply any new variants. Do A/B/C tests after the product launch or in the soft-launch stage to determine what resonates the most with your audience. Do A/B/C/D tests for concept testing.
- If you get a positive result for a short time, wait a few more days to confirm it. For non/equal sample splits ( A/B/B or A/B/C tests) measure the results with scaled installers.