What are marketing metrics and why do you need them?
Marketing metrics are indicators that show how effective mobile ads for your project are.
For instance, a mobile marketer named Harry has started working with a casual mobile game. They studied which ad settings had been the most effective for the game before, and launched a few campaigns with large budgets. Several days later Harry looked at the metrics and saw the campaigns weren’t breaking even. What do they do next?
There’s a few options:
- They decide the project has stopped being profitable and stop working with it.
- They change the GEO or ad assets and launch new campaigns with similar settings.
- They look at key marketing metrics and make the decision based on their findings.
If Harry chooses the first option, they lose the project and the profits. If they go for the second one, they’ll keep losing money until, through trial and error, they find a working setup.
But if Harry knows the marketing analytics and knows their way around the metrics, they’ll first conduct research, find the reasons for poor performance, launch new campaigns and make a lot of money.
Knowing the metrics and how to use them allows you to dig deeper: to see not only what is happening to a purchase, but also why. This, in turn, allows you to adjust the strategy and greatly increase performance.
What metrics are there and what do they show?
Let’s begin with the ones upon which the principle of paid UA is built — earn more than you spend. Those are CPI (Cost Per Install) and LTV (Lifetime Value). They help calculate the return on investment, return on advertising spend and return on marketing investment (ROI, ROAS and ROMI). Without those you won’t be able to see whether or not you’re earning anything from the ads.
The following metrics tell more precisely about mistakes and successes of your ad campaigns and how they reflect on the money:
CPI (Cost per install)
Calculated as: total cost/total installs, meaning the money spent on ads is divided by the number of app installs.
CPI can help, for example, group countries for campaigns. You put countries with similar CPI into the same group. That gives you a hierarchy and you see how much each install costs you in specific countries. This will help you better segment the audience and avoid user dispersion.
CPA (Cost per action)
Calculated as: total cost/total actions. meaning the money spent on ads is divided by the number of target actions. Anything can be a target action: in-app purchase, filling out a form, registration, viewing an ad, placing an order, buying a subscription, etc, depending on the app vertical.
You can group ad creatives the same way.
LTV (Lifetime value)
LTV represents the average amount of money a user will bring in over their entire “life” within the game.
LTV is impossible to calculate until the app has a minimum user base. But as soon as it’s established, you can forecast the advertising profit.
Like CPI, LTV helps you group countries for ad campaign launches.
RR (Retention rate)
Retention rate is the number of users that return into the app at least once after an install, within a certain period of time.
RR is best evaluated by cohort: for example by Day 0, 1, 7 or 30. These metrics are called Retention Day 0, Retention Day 1, Retention Day 7 and Retention Day 30.
RR Day N is calculated as: number of users who returned on day N, divided by number of users who installed the app N days ago, multiplied by 100%.
It’s worth watching RR in order to attract users who are really interested in the app. This is especially important during ad creatives testing and selection. The lower the RR day 0, 1, 3 for the creatives, the fewer users will stay after a week, a month and a year.
ARPU (Average revenue per user)
Calculated as: total revenue/total users.
ARPU is good for evaluating the app efficiency and comparing multiple projects.
At first glance it seems the ARPU and LTV are very similar. The difference is that ARPU shows actual revenue per user, taking into account both paying and non-paying players. LTV, however, can only help forecast the revenue per user.
ARPPU (Average revenue per paying user)
A paying user is one that has at least once purchased something within the app during a set period of time.
Calculated as: total revenue/total paying users.
In addition to the monetary metrics, it’s important to mention two more, which help not only evaluate the strategy efficiency, but also the quality of ad creatives — the IPM and RR.
IPM (Installs per mille)
IPM represents the number of installs per 1,000 ad impressions.
Calculated as: total installs/1000 impressions.
Increasing this metric is possible by using the right creatives. When a creative hits the right target audience, the ad campaign’s rating increases, the advertisement receives more traffic and more impressions.
How can we see these metrics?
To track the metrics, you just need access to the advertising account with which campaigns are launched. Any traffic source allows not only to evaluate metrics within but also create custom metrics and templates. That way you’ll be able to control traffic purchasing and optimise it for your KPI in real time. Also, you can get reports for analysis on nearly all ad venues.
You can also monitor metrics through a tracker. A UA tracker is a piece of software used to automate collection, processing and analysis of information about ad campaigns. It’s not an analytics system but some trackers have the necessary functionality to analyse iOS and Android apps for user behavior, campaign ROI and revenue calculations. Examples are AppsFlyer and Adjust.
Main metrics for different traffic sources
There is a basic set of marketing metrics, which should be watched throughout every ad campaign. This applies to any mobile app vertical and any traffic source. The set includes:
- CTI (Click-to-install) — number of installs per click
- CTR (Click-through rate)
- IPM (Installs per mille) — number of installs per 1000 ad impressions
However, there are metrics that vary by importance of traffic source and purchasing strategy. For mobile games the two most popular sources are Facebook and Google Ads. Let’s talk about those.
Millions of people log into Facebook daily, which makes it the optimal solution for promoting various apps. There are several strategies for purchasing traffic on Facebook. They’re also called campaign optimisation variants:
- Value
- App installs
- App events
- Link clicks
Value and App events are the ones used most for games. When optimising for Value, it’s important to keep an eye on ARPPU and CPPU (Cost Per Paying User), since this strategy is aimed at maximising the total purchase sum.
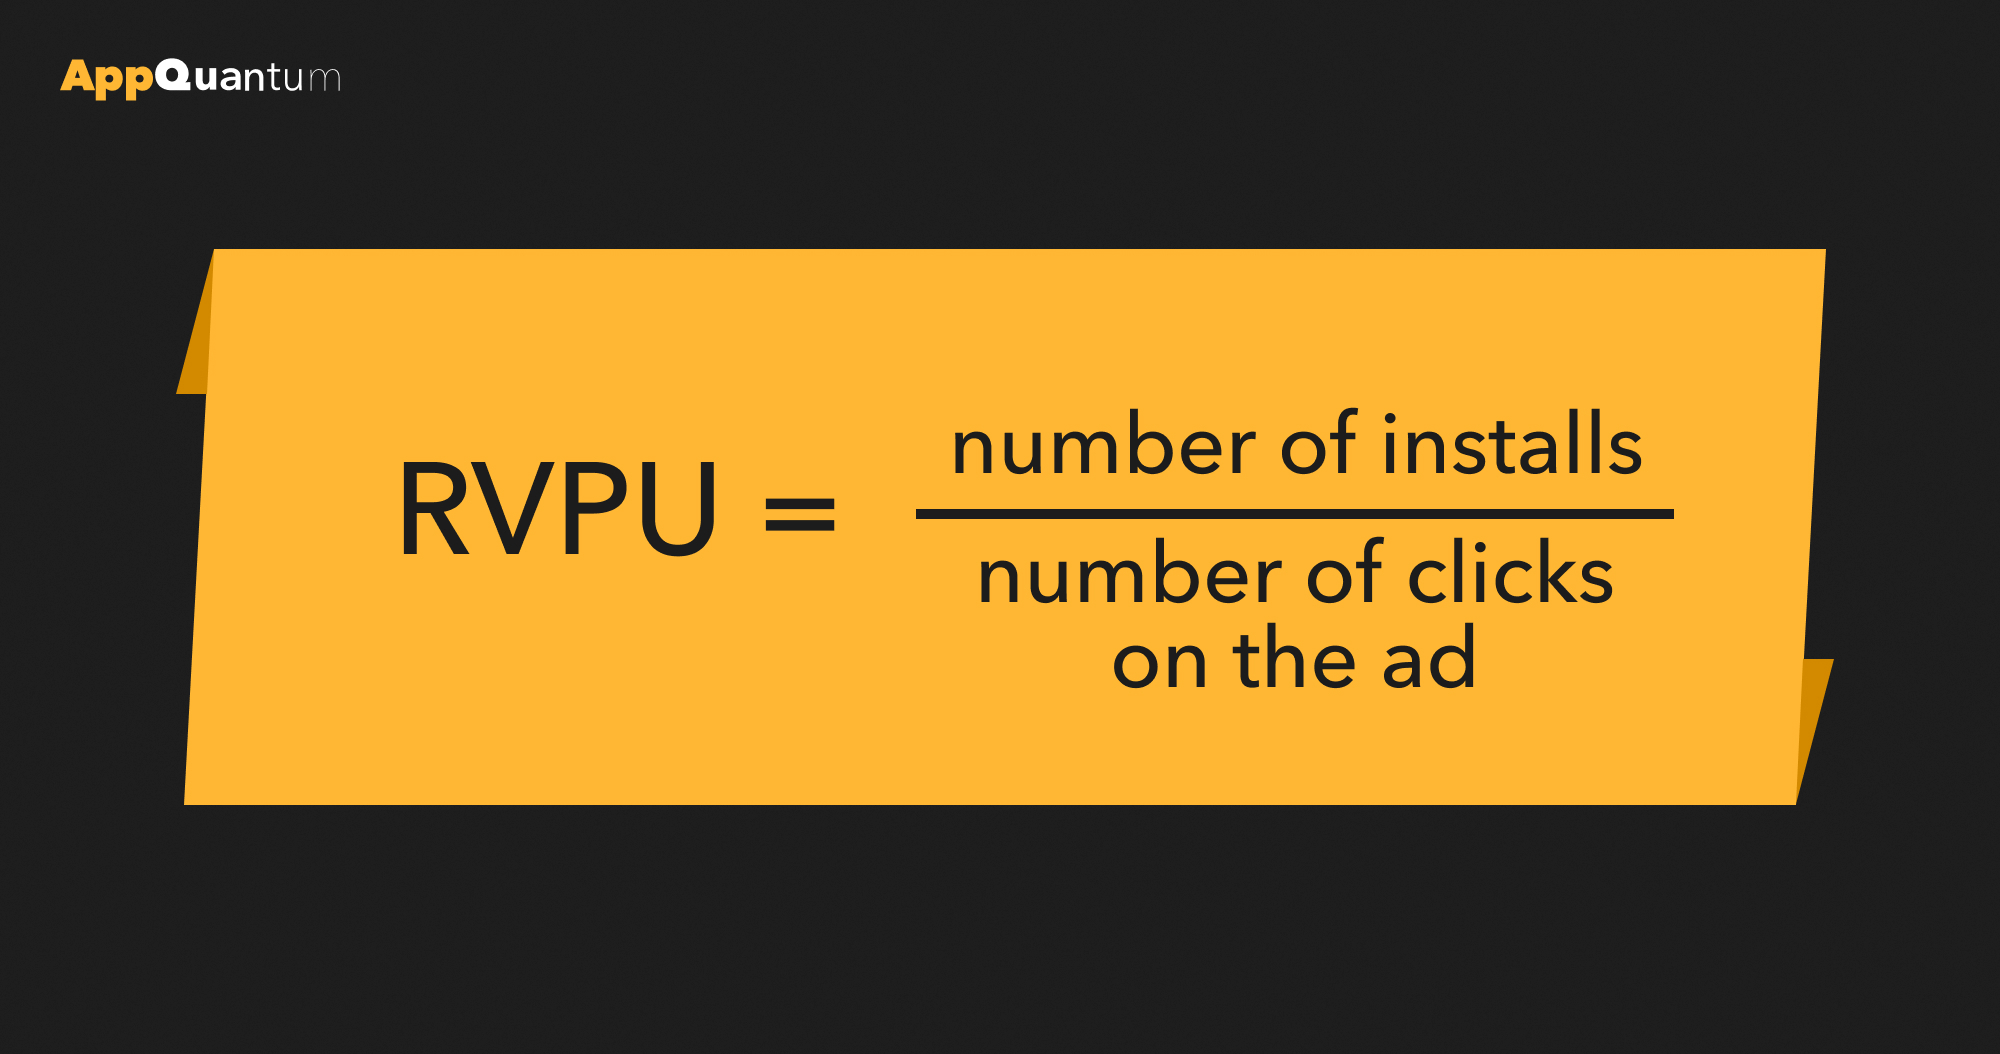
When optimising for App events, watch out for RVPU (Rewarded Video Per User) — number of rewarded video views per user. This strategy is meant for finding an audience that will most likely perform a target action. RVPU helps evaluate how relevant an audience is.
Earlier we mentioned that a good creative is a prime component of a profitable traffic purchase. To evaluate a creative’s quality and efficiency on Facebook, you should look at the Creative Watchtrough Percentage. This data can be viewed right in the ad account: Video plays at 25%, Video plays at 50%, Video plays at 75%, Video plays at 100% — which shows the number of your video views at 25%, 50%, 75%, and 100% of its full length.
This is calculated as the number of installs, divided by the number of clicks on the ad. An important metric, it tells about non-relevant audiences and creatives’ inefficiency, if low.
Google Ads
In Google Ads, there are similar purchasing strategies, but under different names:
- tCPA bidding — Event Model. The “t” is short for target. This strategy is aimed at finding new users, who will perform the target action within the set budget and target cost per action — tCPA.
Key metric for tCPA bidding is — CPA, but also keep an eye on CPI, CTR, IPM, CTI.
- tROAS bidding — Value Model. This strategy is all about finding new users who will complete a select action within the app, while going for the target advertising costs profitability — ROAS.
Key metric for tROAS bidding — Conversion Value/Cost (factual ROAS). It helps with timely optimisation of campaigns based on their efficiency. In other words, it shows us whether or not the campaign reaches the target tROAS value.
Another important metric for tROAS optimisation is CPPU (Cost Per Paying User). The higher CPPU, the lower is conversion into unique payment, and thus the smaller in-app revenue brought in by the campaign.
What’s really important
The next level for Harry as a mobile marketer will be calculating their KPI and building a traffic purchasing strategy, in order to gain desired revenue from the app. But this is a story for another time. For now, if you wonder how to develop marketing for your mobile game, hit us up! We’ll help you make it a hit.


