


Mobile app analytics offer a world of data and a great opportunity for you to get to know your users better. But if you’re not intentional about what you’re looking for in this data, it’s easy for companies to be just as unfocused as they would be without that data.
If you’re just launching your mobile app, you’re fretting about data points like the number of total downloads, your ranking on the app stores, and the number of time users spend on your app.
But to get the most out of mobile app analytics, you need to pick KPIs which actually reflect how much value your users are getting out of the app and how much value they’re delivering back to you in turn.
Number of apps
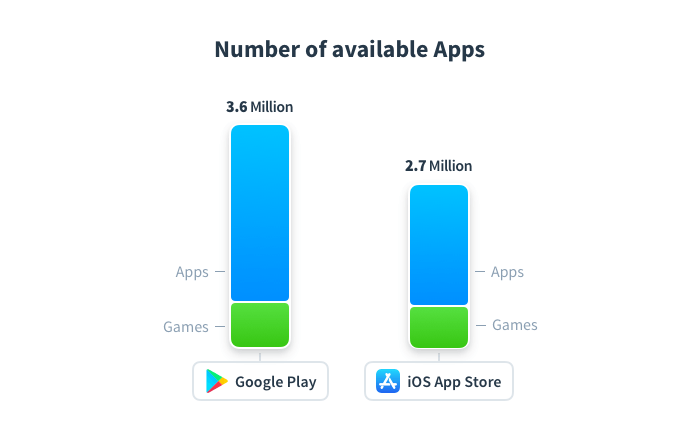
Source: AppRadar
What is mobile app analytics?
Mobile app analytics is an important viral marketing tool and is essential for software developers, product managers, and app marketing teams. They give you real insights into how users are behaving: what’s working for them and what isn’t. These enable you to make data-driven decisions about how to improve the product rather than operating on potentially-faulty assumptions.
Silicon Valley companies are obsessed with shipping the “minimum viable product” as soon as possible. This may seem counterintuitive to people who’d rather polish their mobile app to perfection. But these companies know the value of analytics and getting their app in front of real users.
This type of user data is critical to any kind of business, whether it’s measuring product usage or SMB phone system statistics. By scrutinizing and responding to mobile app analytics, businesses can center their decisions around their customers’ needs and better serve them over time.
It’s not just product decisions that can be enhanced by mobile app analytics. It’s also a crucial part of the ongoing marketing strategy for the app. There are over two million apps on the App Store alone, and you need to stand out from that crowd. Mobile app analytics is the only way you can optimize your app for growth and successful conversions that turn potential customers into regular users.
The importance of mobile app analytics
30 days after installation, only 13.3% of people who install your app will still be using it on average. Mobile app analytics are incredibly important for figuring out how people use your app, what causes people to drop off, and keeping as many people engaged as you can.
For example, one B2B SaaS app targeted at real estate agents found that users would log in a couple of times and then stop using, it just after they’d registered. In such a lucrative business, there was a lot of money to be made from each user, so identifying why this was happening was extremely important.

By looking at the data and mobile app actions they were able to break down “engaged” vs. “unengaged” users, then onboard new users into those actions associated with high engagement. The median number of logins per month rose from 10.6 to 18.3, and they increased user retention as well as referrals.
How to analyze user behavior
Now, let’s discuss some key pieces of data you should pay attention to from the outset. These are essential for getting the most value out of your app marketing and identifying your most important audiences.
Cost per acquisition
Carefully segmenting your audience acquisition is critical to measuring your ROI. When your users come from anywhere from pricey App Store adverts to low-cost ASO efforts, you can easily get confused about which of your actions have the most effect. Therefore, cost per acquisition is an important KPI for app marketing teams who need to get the most out of their advertising spend. CPA = Total Advertising Cost/Total Number of Conversions
Lifetime Value (LTV) per user
“Lifetime value” measures how much your users will spend on your app. “Lifetime” here refers to the amount of time they’ll spend in your app before they churn, which could be days, months, or years away. Remember that lifetime value can be calculated differently. The calculation depends on the monetization model of your app, whether your app is a paid app, an ad-supported app, or a subscription business.
Also, keep an eye on lifetime value compared to the average “lifetime” of users. To improve this stat, you’ll either be trying to convert low-spending users into higher-spending ones or be trying to convince users to stick around for longer.
Churn
If you’re familiar with web analytics, then you’ll know your way around Google analytics bounce rate vs exit. Your churn rate is similar. It tells you how many users have stopped using your mobile app. If you inspect your churn rate closely, you should be able to see patterns and figure out why users are abandoning your app.
Mobile app analytics has transferable skills from the world of web analytics, but there are some key differences. While web analytics platforms can only tell you a little about what’s happening on your site, you can use analytics on mobile to learn a lot more. All it takes is a few lines of code and you can track anything you’d like, including:
- Offline usage, useful for outdoors-y apps where users will be away from wifi/cell networks
- Short session timeouts, measured in seconds rather than minutes
- On-device information such as GPS, storage, and even the accelerometer
- More granular cohort analysis, enabling more optimization for specific user groups
Tips: if you’re struggling to keep your app retention rate up consider adjusting factors such as app on-boarding, in-app and push notifications, intro tutorials, email marketing, social media marketing, and more.
Adoption and acquisition
You should cast a wide net and link to your app on as many pages as you can. Then you can look at this acquisition metric and double down on what’s working. Use tracking links across all your acquisition channels like social media posts and paid advertising.
“Lifetime value per user per acquisition channel” would be a great stat to track. This would help you identify which advertising partners and networks are getting you the best ROI in the long term.
You can calculate customer lifetime value by multiplying the customer value – their average number of purchases multiplied by the total value of those purchases – by the average customer “lifetime”, the length of the business relationship.

Sectors
Depending on your sector, your priorities will be different for mobile app analytics.
Ecommerce retailers will be focused on micro and macro-conversions in the purchasing journey. These will be events like adding items to the cart, completing the purchase, and signing up for an account on the site. In low-margin sectors like travel, they’ll be looking at more detailed analytics per purchase like average order value and the time users are booking in. This enables them to use data they get from their mobile apps to optimize everything they can – like focusing their marketing budget on high-value customers – to make as much profit as they can from the resources they have.
Tools
Most teams using mobile app analytics are using a stack of different apps linked together. This is because of the powerful integrations many analytics apps offer. But you can make a start with any one of these popular mobile analytics tools:
- Google Tag Manager is an interface that is likely familiar to your digital marketing team. Another benefit of Google Tag Manager is that, unlike other mobile app analytics solutions, you can change the parameters you want to track without having to push a software update to users’ phones.
- Apptimize is a leading A/B testing platform used by brands like Glassdoor and Hotels.com. Apptimize is focused on working cross-platform, which enables consistent testing across iOS, Android, and desktop versions of your app.
- Companies like Atlassian and Instacart use Segment to easily pipe data from your app into whatever other software you use to get things done. Marketing teams can see real-time data down to the level of individual customers, and other teams are empowered by much better data in the tools they already use.
Best practices
Once you’re set up with mobile app analytics, there are a few best practices that can be used to ensure you keep moving in the right direction while you figure out what works for your company.
Only measure what matters
Mobile app analytics can deal with a huge amount of data in the data ingestion process. And with endless ways to segment, combine, and filter that data, there are so many metrics you could track.
But realistically, your app’s success only really hinges on a few crucial KPIs. For example, your average revenue per user or the average total lifetime value of your users.
Andrew Chen, a16z partner and author of The Cold Start Problem, writes that you shouldn’t “build metrics that aren’t going to be part of your day-to-day operations or don’t have potential to be incorporated as such. Building reports that no one looks at is just activity without accomplishment, and is a waste of time.”
Mobile app analytics will allow you to track how users are contacting you through your app and give you a better picture of what happens once they get in touch. It will provide you with better insight into call management, call tracking, and your first-call resolution rate, critical to a good customer experience.
A/B testing
Think of the methodical mobile application testing processes that developers use to fix bugs. You should A/B test tiny changes, which over time, will add up to a greatly improved customer experience.
Data-driven decision-making with mobile app analytics
Mobile app analytics offer a lot of data. But by focusing on certain KPIs and understanding their relevance, you can focus your operations on what gets you the best results. Not only is it good for your app’s growth and conversion rates, but it can also create a data-driven culture in your company that responds quickly to customers’ needs and behaviors.