Our Retail App Report delivers over 150 pages of insights with market size forecasts categorized by region and country. In addition, the report also covers market share statistics, usage and download data, and benchmarks for retail apps.
What was the market size of the retail app industry?
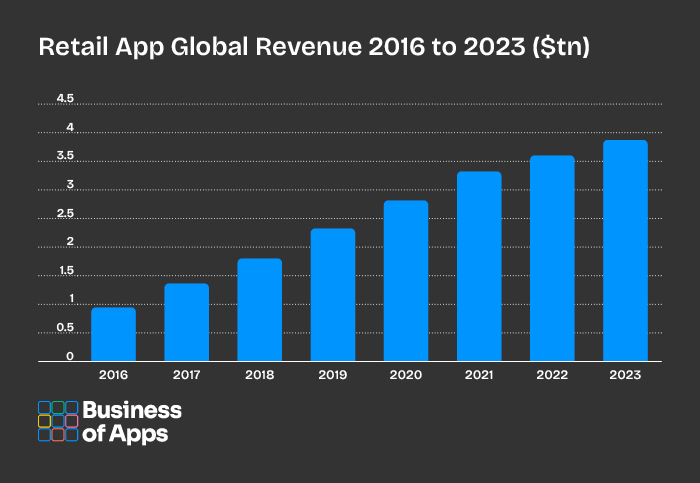
The market size of the retail app industry was $3.8 trillion in 2023, an increase of 8% on the previous year. This is expected to almost double by the end of the decade, led by maturing markets in South-East Asia and Latin America.

Which retail app generates the most revenue?
Amazon is the largest ecommerce company by revenue, generating $574 billion in 2023. Alibaba is the largest in terms of transaction volume, reporting $1.3 trillion GMV last year.
How much retail app revenue originates from China?
China is far ahead of other countries when it comes to retail app spend. It was responsible for over half of spend in 2023. The US generated less than a third of China’s total spend.
Sector overview
Retail played a major role in shaping the early web experience, providing individual vendors and companies with a new way to gain customers. Instead of simply selling to those in an immediate area, the internet provided the tools for people to exchange and purchase from all over the world.
eBay and other c2c services provided web users with the means to exchange goods for cash, with PayPal and other online payments services established to improve the security and verification of these transactions. On the other side, Amazon created a marketplace for “everything”, and have spent the past two decades improving this experience.
Mobile reduced the barriers that still existed between a customer purchasing an item, enabling customers to purchase at any time, anywhere.
In the past five years, we have seen new competition in the retail market come from Chinese-based suppliers. Shein, Temu and TikTok have all been broadly accepted as new forms of ecommerce, offering items for far cheaper than can be found on Amazon or in store.
Table of contents
- Retail App Financials
- Market Size
- Market Size Forecast
- Revenue by Region
- Revenue by Country
- Individual Retail App Revenues
- Individual Retail App GMV
- Percentage of Online Retail as Mobile
- Percentage of Total Retail as Mobile
- Spend Per Capita
- Retail App Market Share
- US Market Share
- UK Market Share
- China Market Share
- India Market Share
- Southeast Asia Market Share
- Latin America Market Share
- Retail App Usage
- Total Users
- Users Forecast
- Users by Region
- Users by Country
- Individual Shopping App Users
- Retail App Downloads
- Total Downloads
- Downloads by Region
- Individual App Downloads
- Retail App Demographics
- Age Demographics
- Gender Demographics
- Retail App Benchmarks
- Marketing Metrics
- Buying and Purchasing Benchmarks
- Usage Metrics
The Retail App Report – Research, Insights and Statistics is provided as downloadable PDF document with all data presented as charts and tables. So you can easily extract graphics and individual data. It provides an overview of the Shopping App sector’s financials, usage, downloads, market share, demographics, and benchmarks.
What’s included?
- Document: PDF
- Charts: 163
- Data Points: 2188
- Pages: 169
The Retail App Report – Research, Insights and Statistics has been assembled by our in-house team of analysts at Business of Apps. We believe this is the most comprehensive report available on the Shopping App market. If you have any questions get in touch data@businessofapps.com.
What apps are covered in this report?
- Amazon
- eBay
- Wayfair
- Etsy
- Temu
- Shein
- Zara
- H&M
- Vinted
- ASOS
- Alibaba
- Pinduoduo
- JD.com
- Flipkart
- Shopee
- Meesho
- Rakuten
- Mercado Libre
- Walmart
- Tesco
- Sainsbury’s
- OTTO
- Wish
- TikTok Shop
List of Charts
- Retail App Market Size
- Retail App Forecast Market Size
- Retail App Revenue by Region
- Retail App Forecast Revenue by Region
- Asia-Pacific Revenue Forecast
- United States & Canada Revenue Forecast
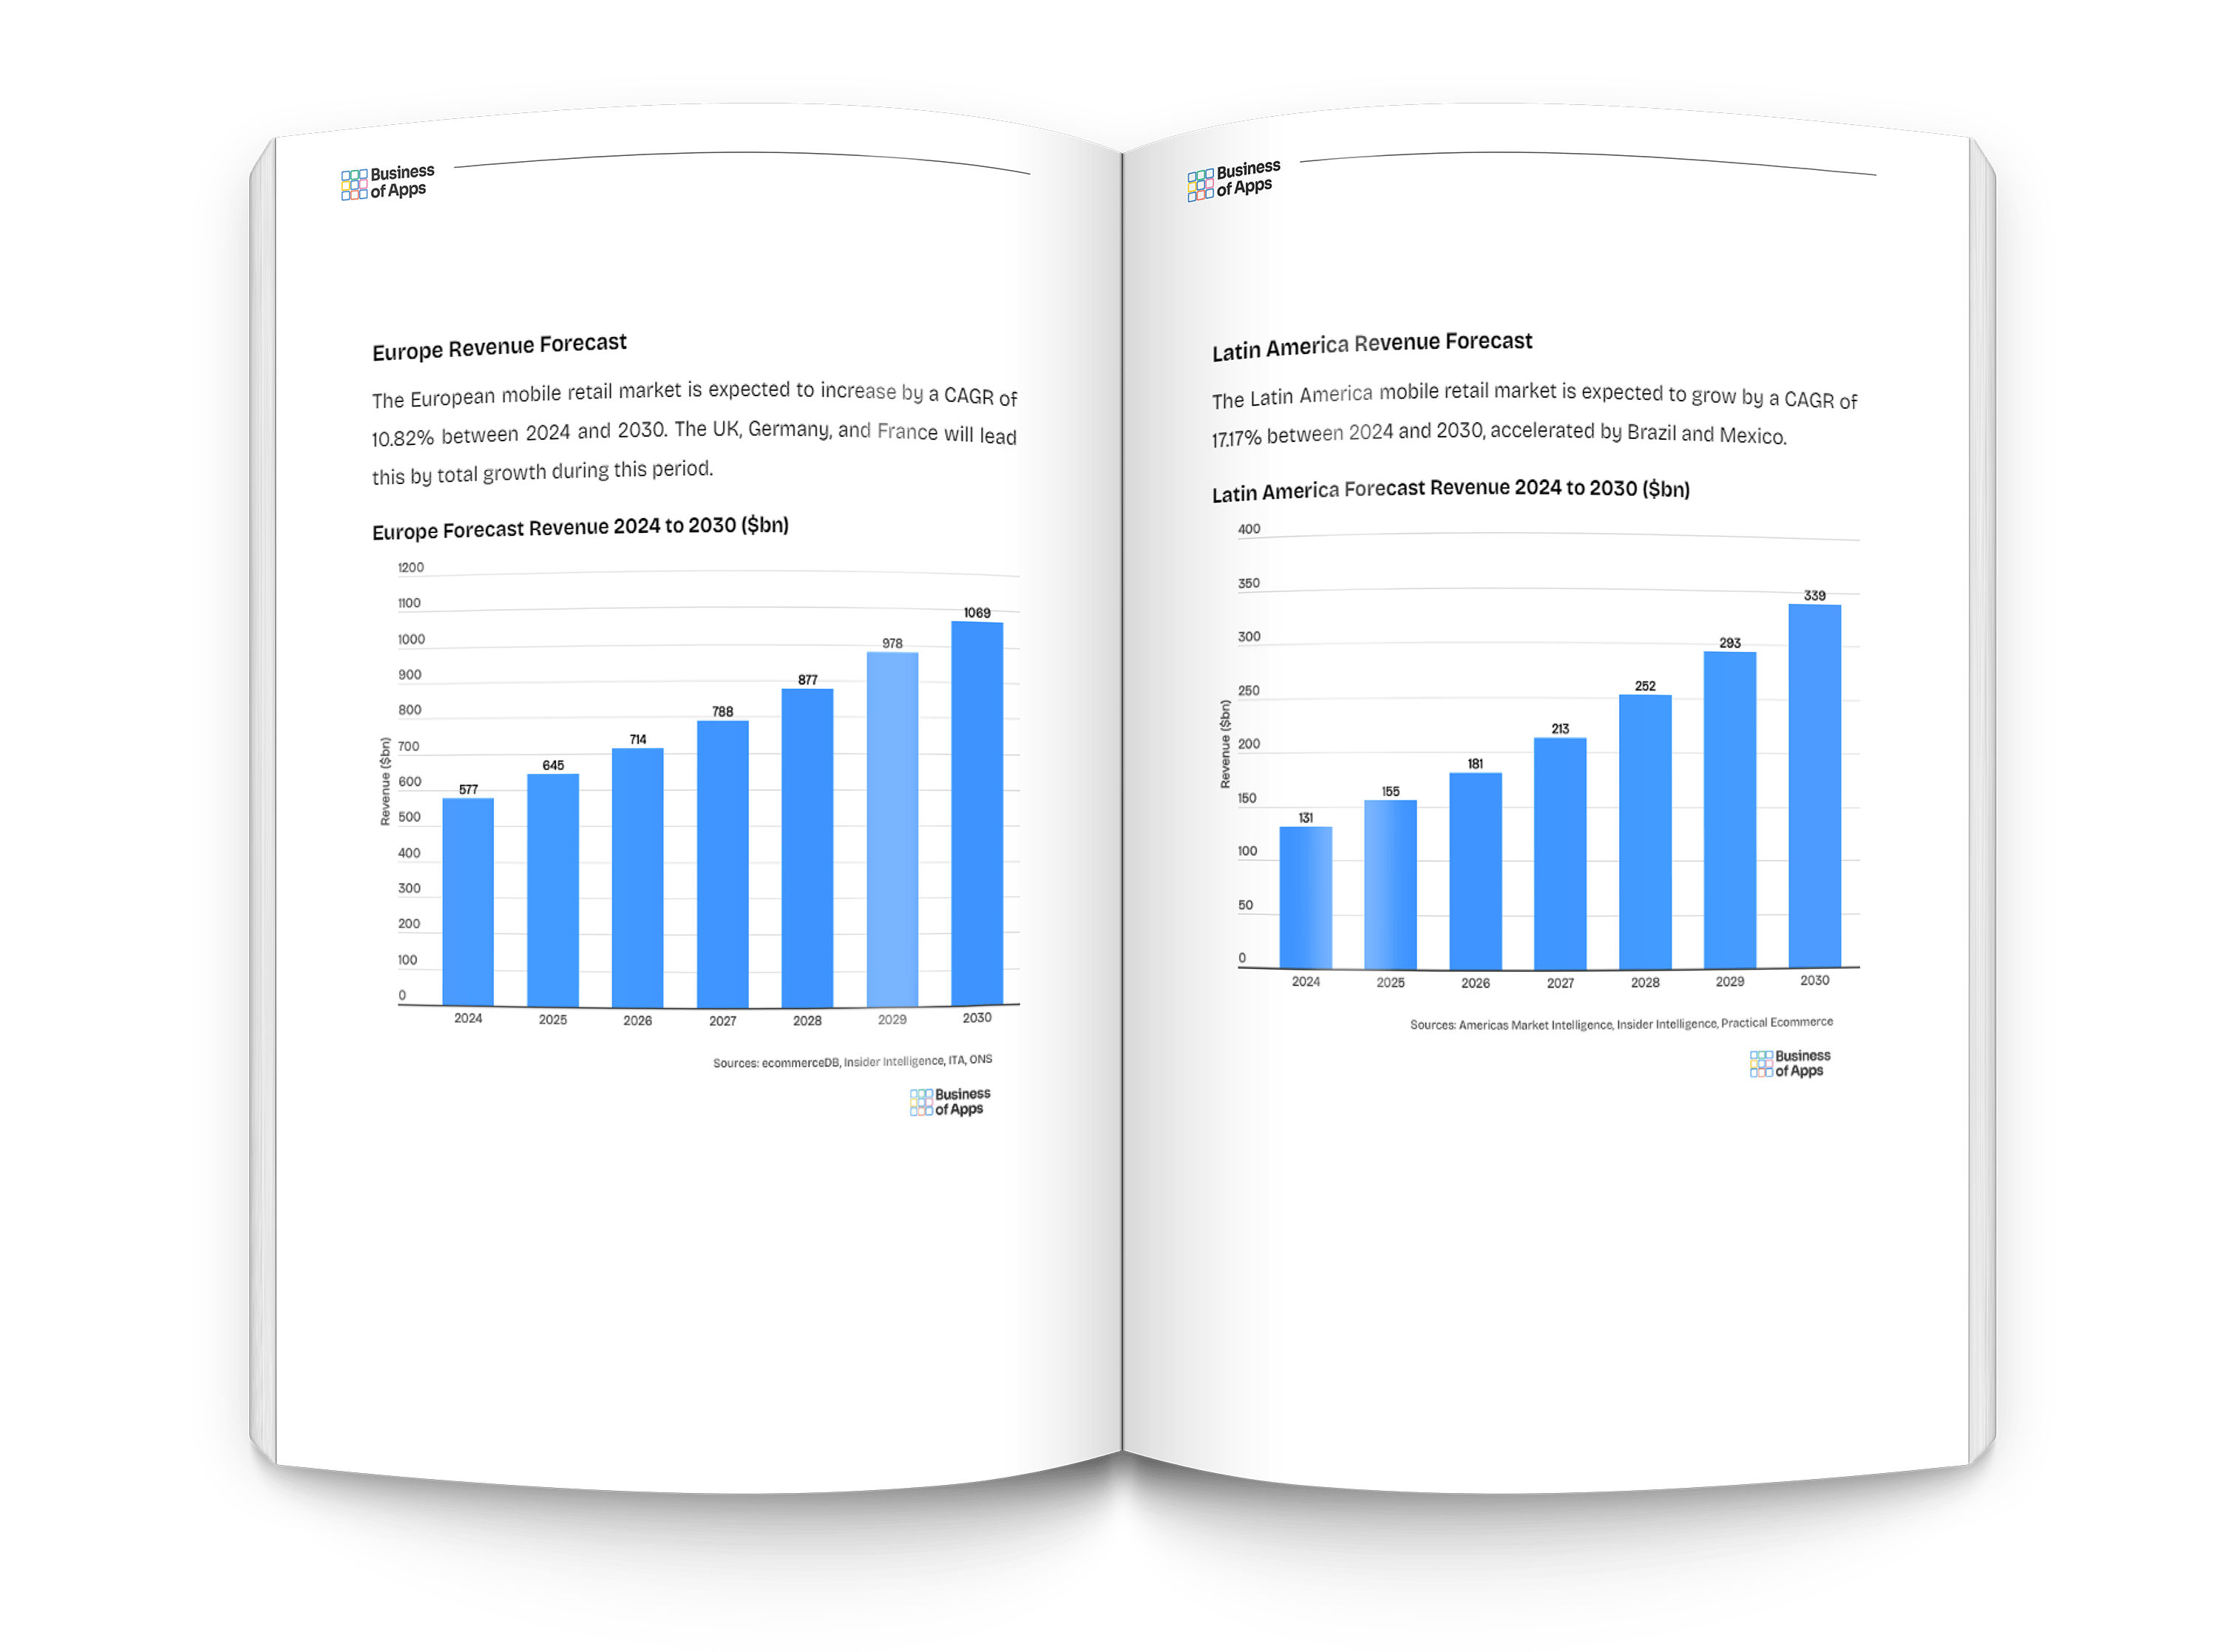
- Europe Revenue Forecast
- Latin America Revenue Forecast
- Middle East and North Africa Revenue Forecast
- Sub-Saharan Africa Revenue Forecast
- Retail App Revenues by Country
- United States Retail App Revenues
- United Kingdom Retail App Revenues
- China Retail App Revenues
- India Retail App Revenues
- Germany Retail App Revenues
- France Retail App Revenues
- Southeast Asia Retail App Revenues
- Latin America Retail App Revenues
- Middle East and North Africa Retail App Revenues
- Amazon Revenue
- Alibaba Revenue
- JD Revenue
- Pinduoduo Revenue
- Wayfair Revenue
- eBay Revenue
- Etsy Revenue
- Shein Revenue
- Zara Online Revenue
- H&M Online Revenue
- ASOS Revenue
- Flipkart Revenue
- Shopee Revenue
- Meesho Revenue
- Rakuten Revenue
- Mercado Libre Revenue
- Walmart Online Revenue
- Tesco Online Revenue
- Sainsbury’s Online Revenue
- OTTO Online Revenue
- Wish Revenue
- Vinted Revenue
- Amazon GMV
- Alibaba GMV
- JD GMV
- Pinduoduo GMV
- Temu GMV
- eBay GMV
- Etsy GMV
- TikTok GMV
- Flipkart GMV
- Shopee GMV
- Meesho GMV
- Rakuten GMV
- Mercado Libre GMV
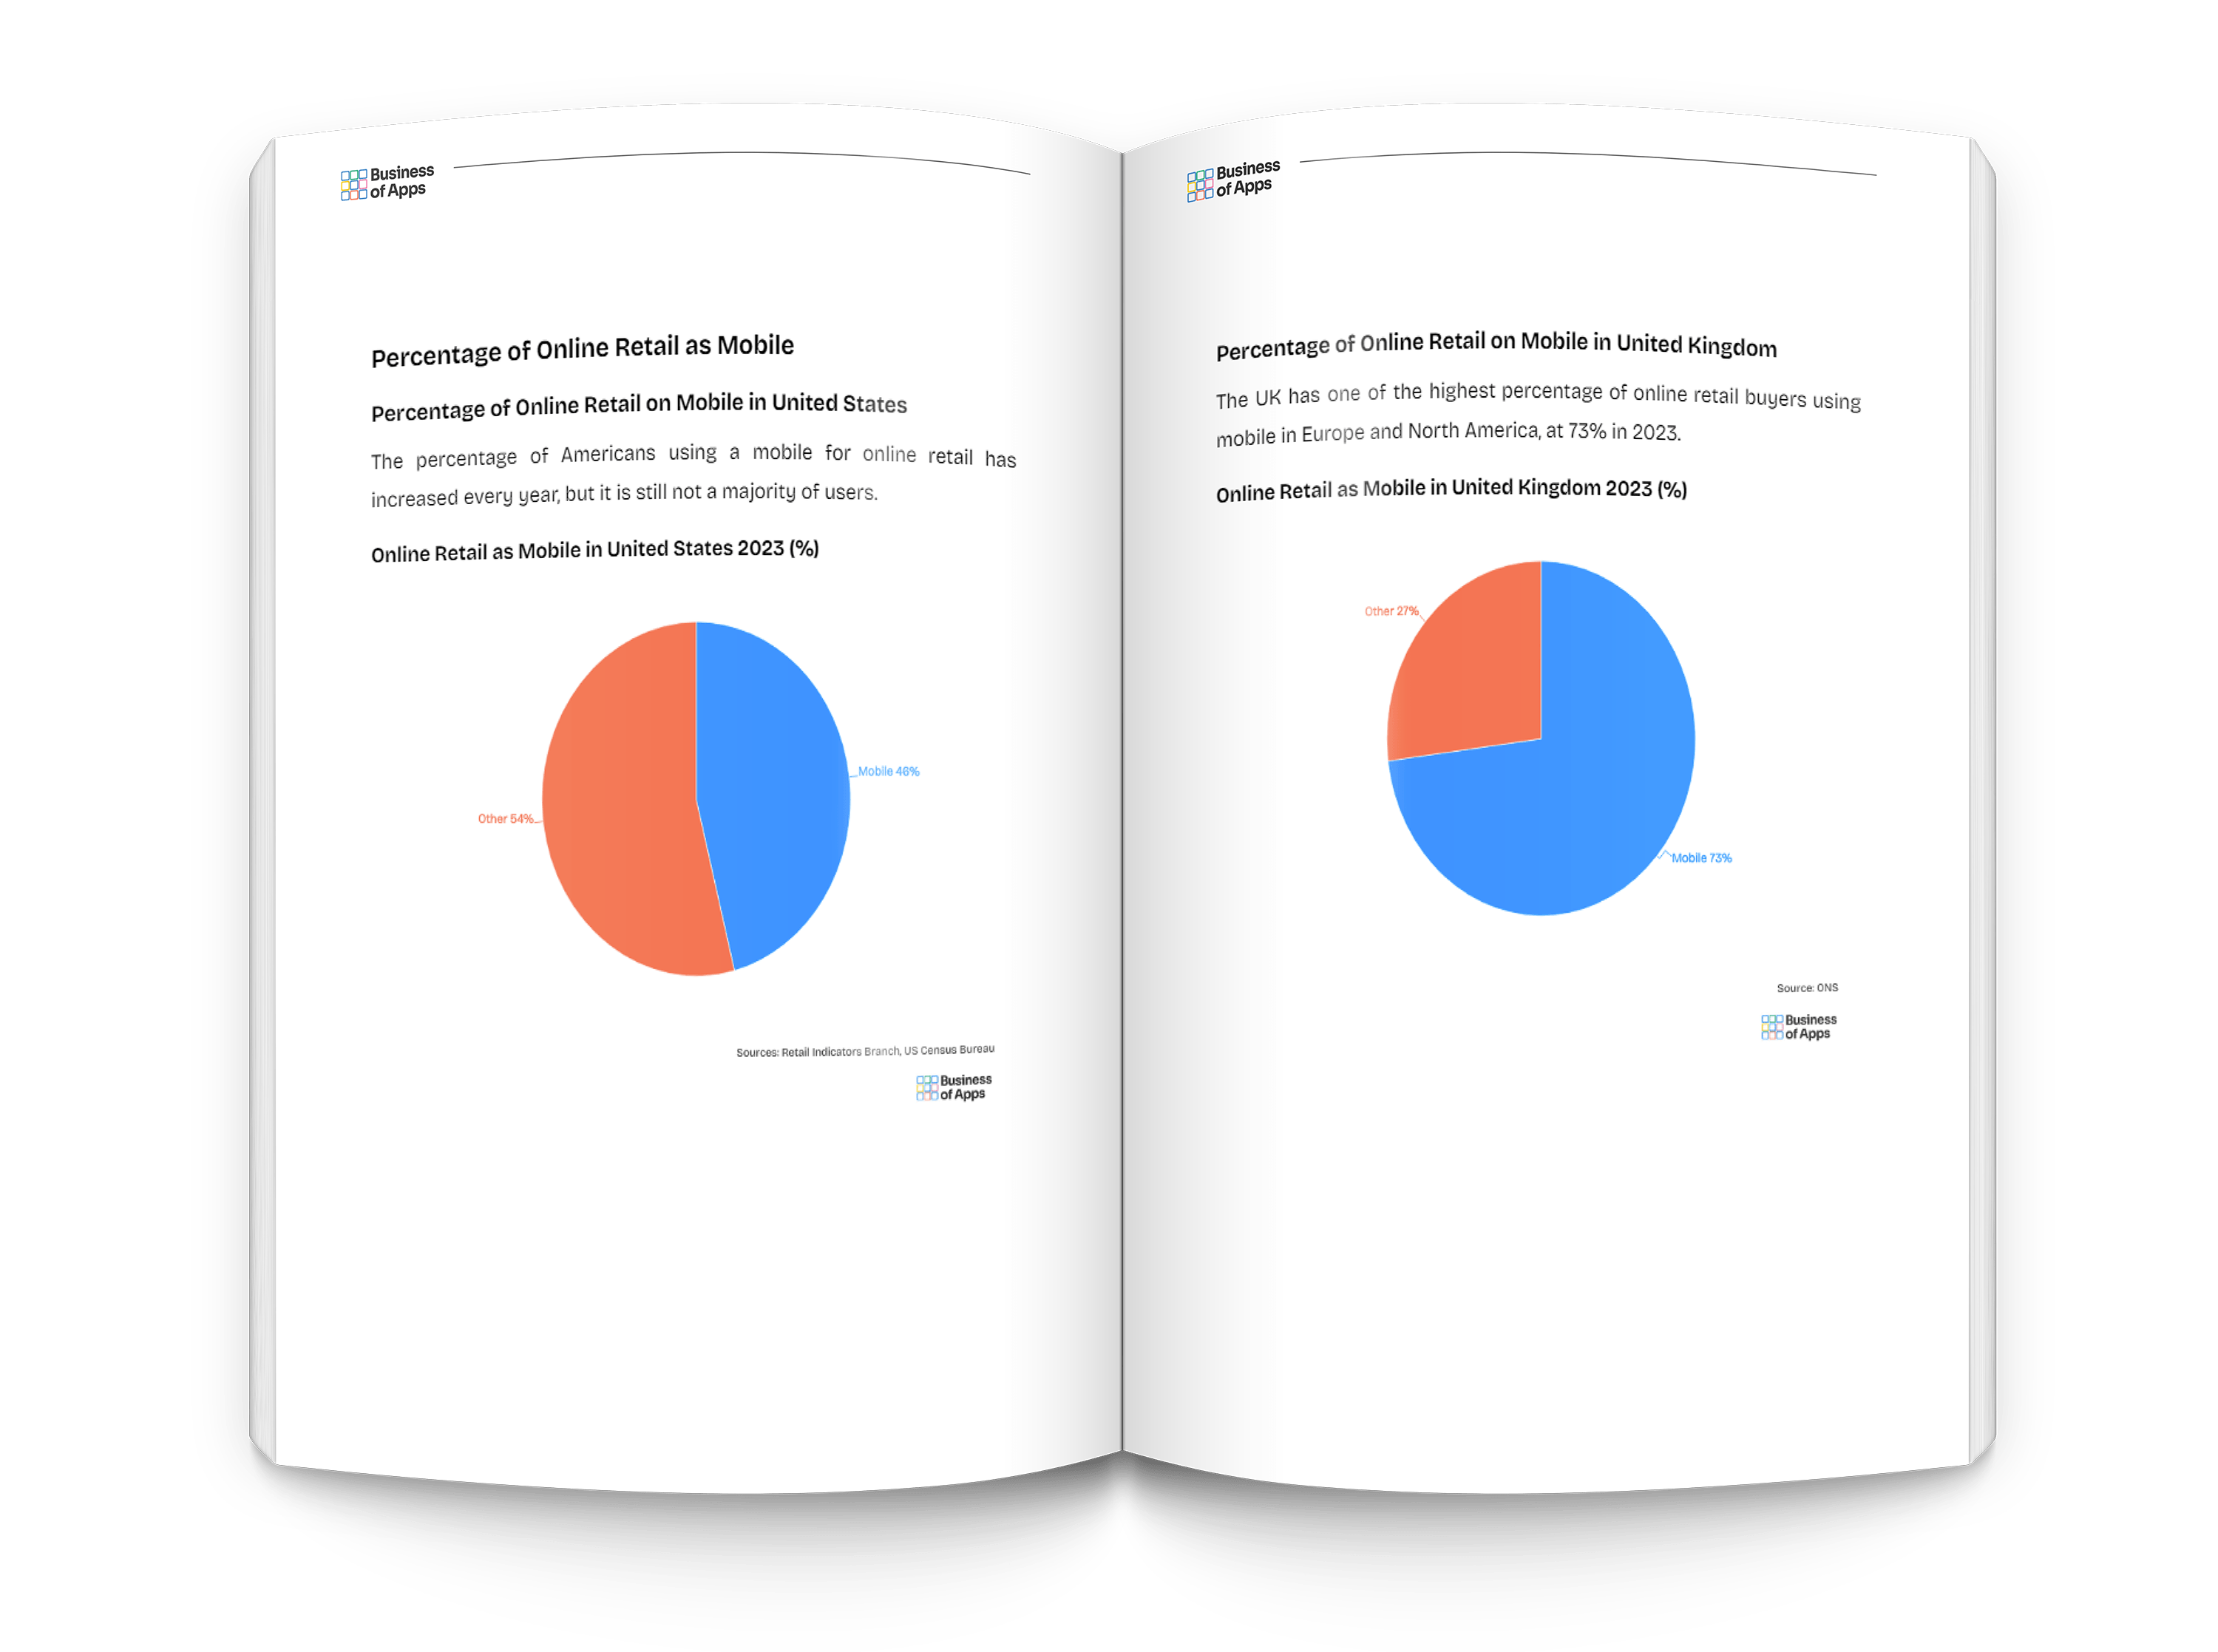
- Percentage of Online Retail as Mobile United States
- Percentage of Online Retail as Mobile United Kingdom
- Percentage of Online Retail as Mobile China
- Percentage of Online Retail as Mobile India
- Percentage of Online Retail as Mobile Germany
- Percentage of Online Retail as Mobile France
- Percentage of Online Retail as Mobile Southeast Asia
- Percentage of Online Retail as Mobile Latin America
- Percentage of Online Retail as Mobile MENA
- Percentage of Total Retail as Mobile United States
- Percentage of Total Retail as Mobile United Kingdom
- Percentage of Total Retail as Mobile China
- Percentage of Total Retail as Mobile India
- Percentage of Total Retail as Mobile Germany
- Percentage of Total Retail as Mobile France
- Percentage of Total Retail as Mobile Southeast Asia
- Percentage of Total Retail as Mobile Latin America
- Percentage of Total Retail as Mobile MENA
- Retail App Spend Per Capita United States
- Retail App Spend Per Capita United Kingdom
- Retail App Spend Per Capita China
- Retail App Spend Per Capita India
- Retail App Spend Per Capita Germany
- Retail App Spend Per Capita France
- Retail App Spend Per Capita Southeast Asia
- Retail App Spend Per Capita Latin America
- Retail App Spend Per Capita MENA
- United States Retail App Market Share
- United Kingdom Retail App Market Share
- China Retail App Market Share
- India Retail App Market Share
- Germany Retail App Market Share
- France Retail App Market Share
- Southeast Asia Retail App Market Share
- Latin America Retail App Market Share
- Retail App Users
- Retail App Forecast Users
- Retail App Users by Region
- Retail App Forecast Users by Region
- United States Retail App Users
- United Kingdom Retail App Users
- China Retail App Users
- India Retail App Users
- Germany Retail App Users
- France Retail App Users
- Southeast Asia Retail App Users
- Latin America Retail App Users
- MENA Retail App Users
- Amazon Users
- Alibaba Users
- JD Users
- Pinduoduo Users
- eBay Users
- Etsy Users
- Wayfair Users
- Shein Users
- Zara Users
- ASOS Users
- Flipkart Users
- Shopee Users
- Meesho Users
- Rakuten Users
- Mercado Libre Users
- Walmart Users
- Tesco Users
- Wish Users
- Vinted Users
- Retail App Downloads
- Retail App Downloads by Region
- Amazon Downloads
- Alibaba Downloads
- JD Downloads
- Pinduoduo Downloads
- Temu Downloads
- Wayfair Downloads
- eBay Downloads
- Etsy Downloads
- Shein Downloads
- Zara Downloads
- H&M Downloads
- ASOS Downloads
- Flipkart Downloads
- Shopee Downloads
- Meesho Downloads
- Rakuten Downloads
- Mercado Libre Downloads
- Walmart Downloads
- Retail App Age Demographics
- Retail App Gender Demographics
- Retail App Retention Rate
- Retail App Conversion Rate
- Retail App Install Rate
- Retail App Cart Abandonment Rate
- Retail App Hours Spent
- Retail App Users Acquisition Spend
- Retail App Popular Categories
- Retail App Important Features
How does it work?
To get access to the Retail App Report – Research, Insights and Statistics hit the buy now button above. After payment you will be taken to the download page to access your Shopping App Report – Research, Insights and Statistics PDF. If you need any help email data@businessofapps.com.
We have joined Treeapp, an incredible organization dedicated to reforesting the world. They will plant one tree for your data report purchase.
What our customers say about our reports
“Your report gave us some very useful insights on app statistics. As we are starting to develop apps it’s crucial information”
“This report is great work, it helped us get a better understanding of revenue and growth to include it in our analysis for LatAm. It has been very useful.”
“We have found Business of Apps data to be most accurate and complete on the web.”
“All the metrics and KPIs I was looking for are in one document for a very good price. The report was exactly what I expected.”
"There was an abundance of excellent information in the report, well worth the money. There were areas which had information I haven't seen anywhere else."
"Money well spent as far as I am concerned. A clear, well-written report"
“What a great resource!”
"This data has been a huge help for us launching our dating app"


