This 100+ page report delivers an holistic overview of the video streaming app market, featuring detailed charts on industry trends, financial performance, market share, engagement and benchmarking statistics. It provides valuable insights into the rapid expansion and shifting dynamics of video streaming platforms.
What is the market size of the video streaming industry?
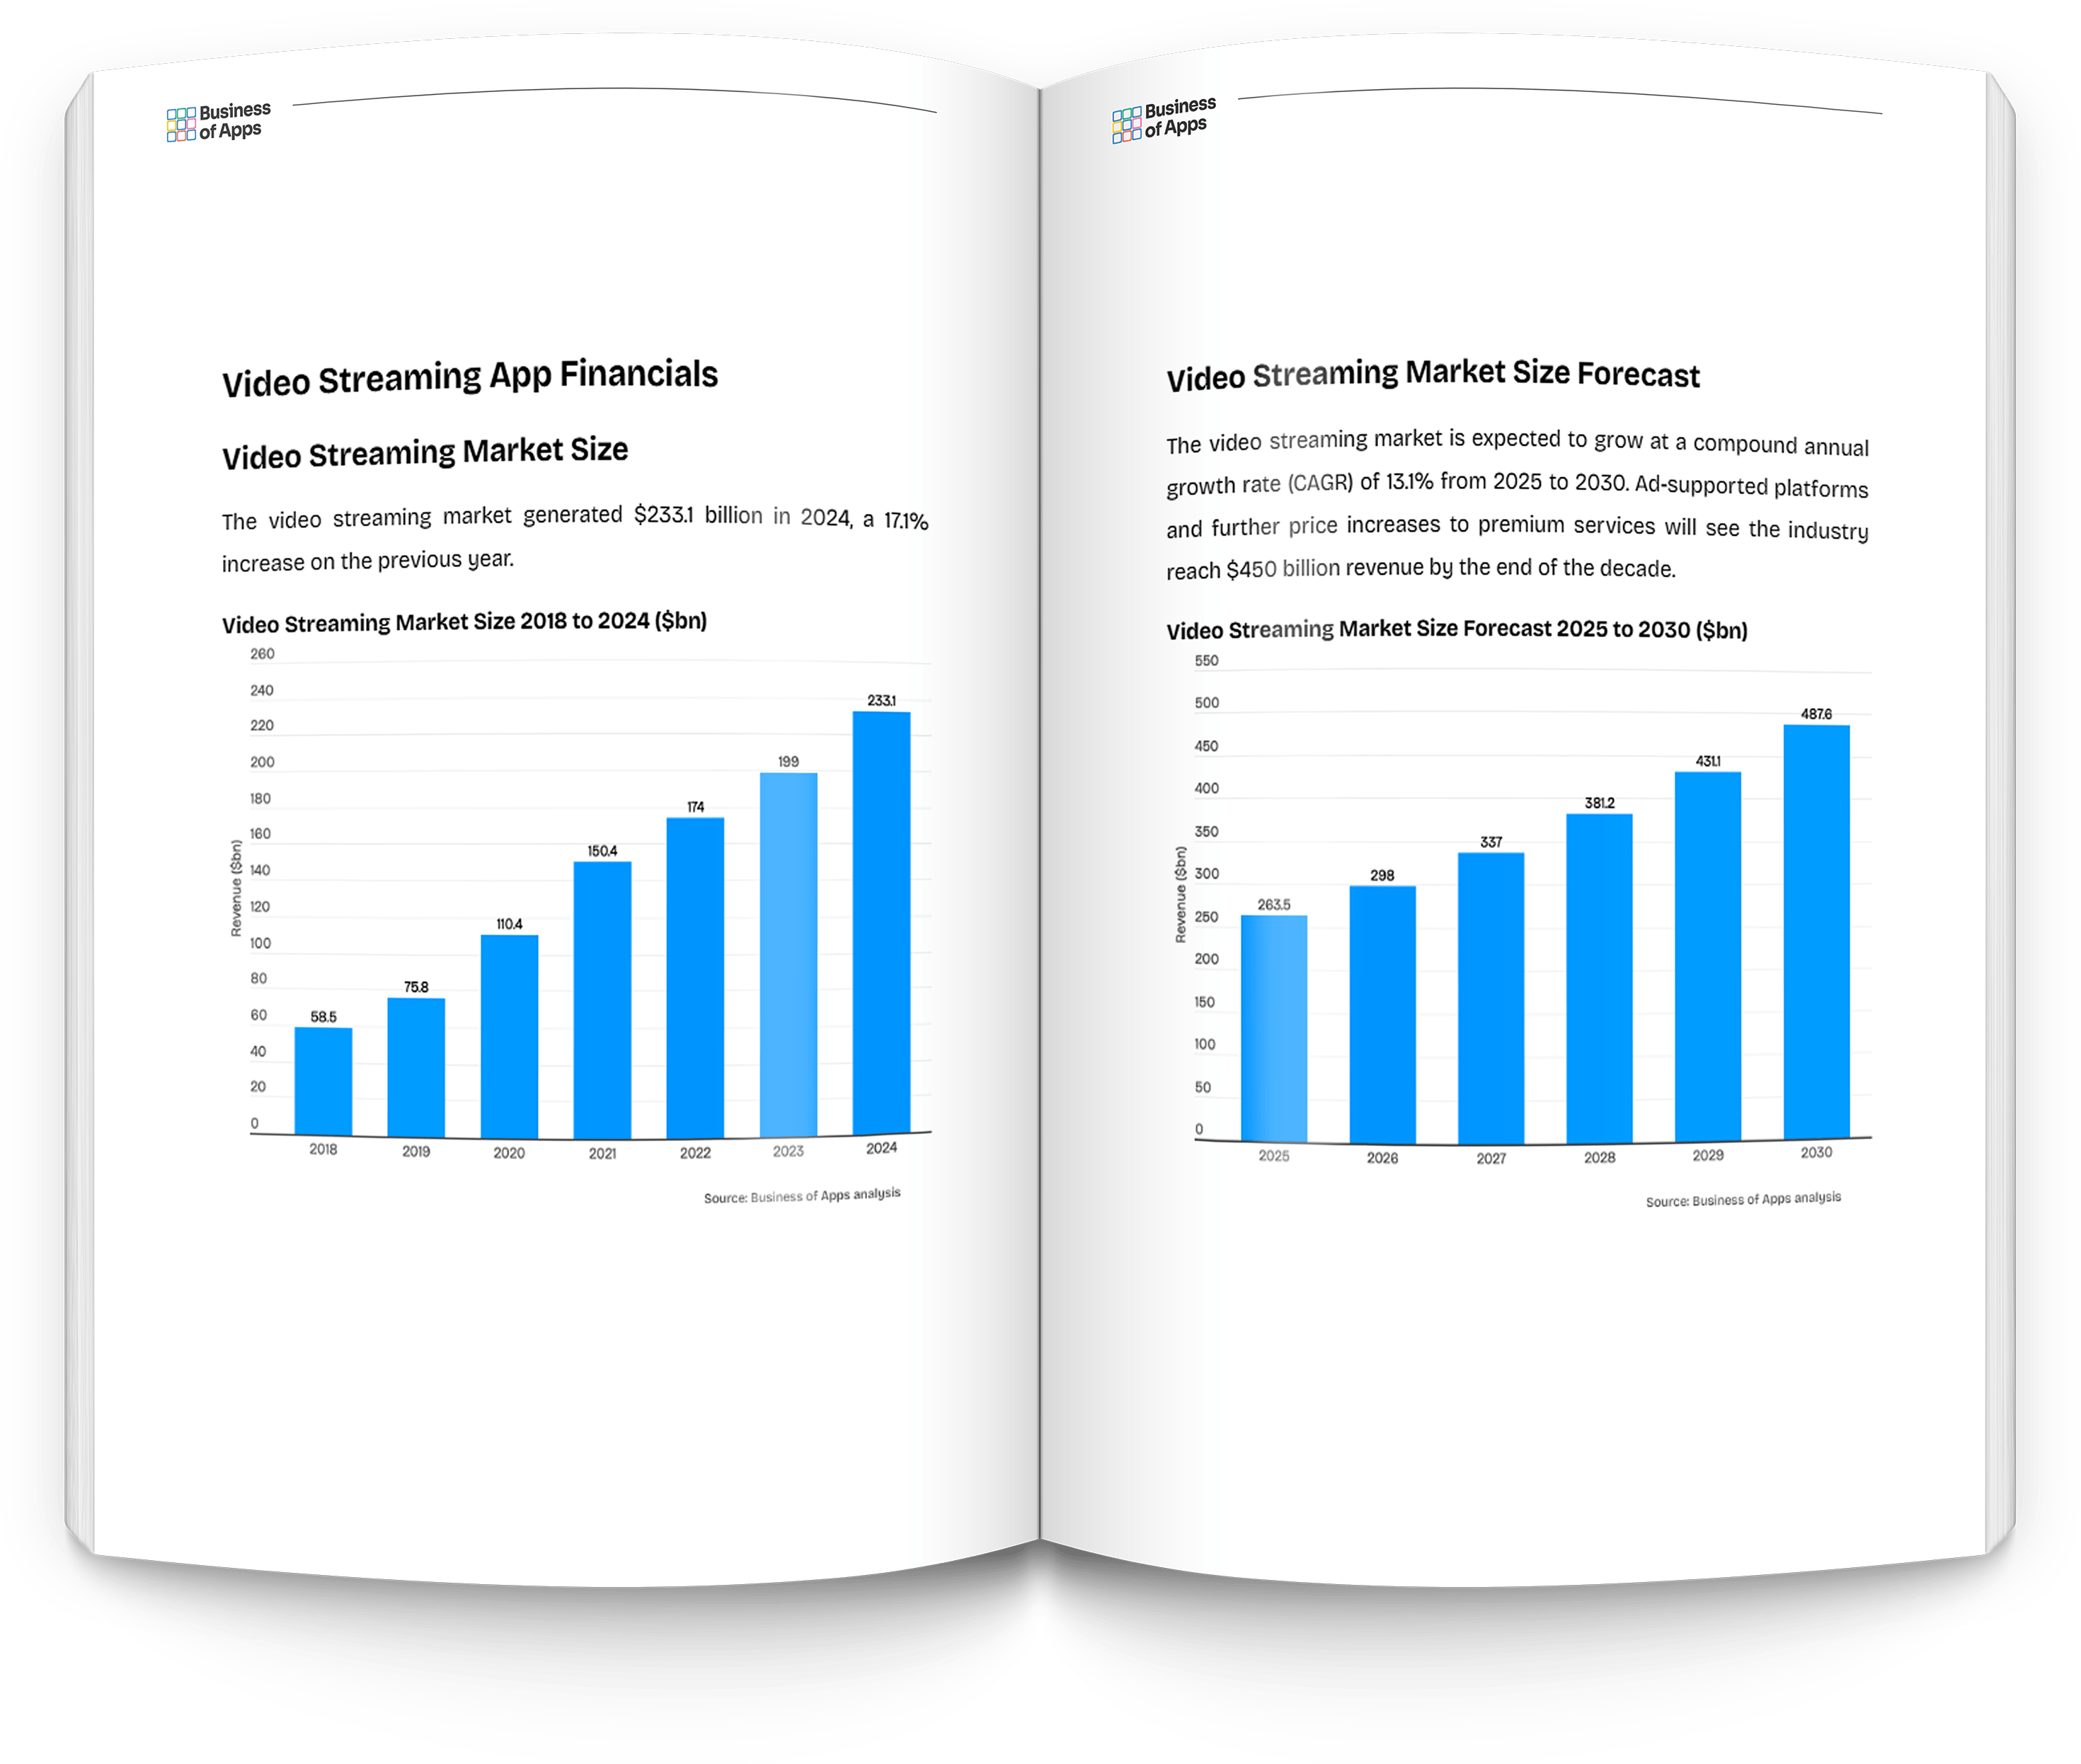
The video streaming industry generated over $230 billion in 2024, an increase of 17.1% on the previous year. Premium video streaming services, such as Netflix and Disney+, accounted for the majority of this revenue.
Which US video streaming app has the most market share?
Amazon Prime Video and Netflix are tied for market share in the United States, both holding 22% of the market. Netflix has seen its market share drop over the past decade, from a lead position of over 40% market share in 2015.
Which video streaming app had the most installs in 2023?
TikTok and Instagram are the two most popular apps on the planet, with over 750 million downloads each. Outside of those two, Netflix had the most downloads in 2024.
Sector overview
The video streaming industry has grown out of two key companies: Netflix and YouTube. Both launched their video streaming platforms in the mid-2000s, YouTube offered users a way to easily upload videos to the internet; Netflix provided customers with a library of digital television and movies.
The growth of these two platforms has shaped the video streaming market. In YouTube’s case, the ability to upload a video from any device at any time created an entire economy of celebrities, streamers and influencers. It also brought about short-form video platforms, such as TikTok and Instagram Reels.
In Netflix, it pulled television and cinema into the 21st century, with the introduction of original series that launched on the web first. Amazon, Disney, HBO and others have followed this method, to varying degrees of success.
These two platforms are still the dominant players in their respective subsectors, but both have faced increased competition over the past half decade. Netflix has had to fend off the introduction of several major streaming platforms in its home market of the US and overseas, while TikTok and Instagram have taken time and eyeballs off YouTube.
Table of contents
- Video Streaming App Financials
- Market Size
- Market Size Forecasts
- Market Size by Region
- Market Size by Type
- Individual App Revenue
- Individual App Net Income
- Individual App Content Spend
- Video Streaming App Market Share
- United States
- United Kingdom
- China
- Game Streaming
- Video Streaming App Usage
- Total Users
- Forecast Users
- Total Subscribers
- Forecast Subscribers
- Users by Region
- Users by Type
- Individual App Users
- Video Streaming App Downloads
- Total Downloads
- Forecast Downloads
- Downloads by Region
- Downloads by Type
- Individual App Downloads
- Video Streaming App Demographics
- Age Demographics by Type
- Gender Demographics by Type
- Video Streaming App Benchmarks
- Usage Benchmarks
- Marketing Metrics
- Subscription Prices
- Performance Benchmarks
- Engagement Benchmarks
The Video Streaming App Report – Research, Insights and Statistics is provided as downloadable PDF document with all data presented as charts and tables, so you can easily extract graphics and individual data. It provides an overview of the Video Streaming App sector’s financials, usage, downloads, market share, demographics, and benchmarks.
What’s included?
- Document: PDF
- Charts: 100
- Data Points: 1985
- Pages: 107
The Video Streaming App Report – Research, Insights and Statistics has been assembled by our in-house team at Business of Apps. We believe this is the most comprehensive report available on the Video Streaming app market. If you have any questions get in touch data@businessofapps.com.
What apps are covered in this report?
- Netflix
- Amazon Prime Video
- Disney+
- Hulu
- Max
- Apple TV+
- YouTube
- TikTok
- Instagram Reels
- Twitch
- Kwai
- Crunchyroll
- Pluto TV
- Tubi
- Peacock
- Paramount+
- iQiyi
- Tencent Video
List of Charts
- Video Streaming Market Size
- Video Streaming Market Size Forecast
- Video Streaming Market Size by Type
- Premium Video Streaming Market Size
- Free Video Streaming Market Size
- Video Streaming Market Size by Region
- Video Streaming Subscription vs Ad Revenue
- Premium Video Streaming Subscription vs Ad Revenue
- Video Streaming Average Spend by Country
- Premium Video Streaming Revenue by App
- Free Video Streaming Revenue by App
- Netflix Revenue
- Netflix Revenue by Region
- Disney+ Revenue
- Hulu Revenue
- Hulu Revenue by Type
- Amazon Prime Video Revenue
- Max Revenue
- Apple TV+ Revenue
- YouTube Revenue
- TikTok Revenue
- TikTok Revenue by Type
- Instagram Reels Revenue
- Twitch Revenue
- Netflix Net Income
- Disney+ Operating Loss
- Warner Bros Discovery Net Income / Loss
- Video Streaming Content Spend by App
- Netflix Content Spend
- Amazon Prime Video Content Spend
- Disney Content Spend
- Video Streaming ARPU
- Video Streaming Market Share in United States
- Video Streaming Market Share in United Kingdom
- Video Streaming Market Share in Germany
- Video Streaming Market Share in Brazil
- Video Streaming Market Share in India
- Video Streaming Market Share in Japan
- Video Streaming Market Share in China
- Game Video Streaming Market Share
- Video Streaming Users
- Video Streaming Users Forecast
- Video Streaming Users by Region
- Video Streaming Subscribers
- Video Streaming Subscribers by Region
- Video Streaming Users by App
- Short-Form Video Streaming Users by App
- Video Streaming Users by App in China
- Video Streaming Subscribers by App
- YouTube Users
- TikTok Users
- Instagram Reels Users
- Twitch Users
- Netflix Subscribers
- Amazon Prime Video Subscribers
- Disney+ Subscribers
- Hulu Subscribers
- Max Subscribers
- Apple TV+ Subscribers
- Video Streaming Downloads
- Video Streaming Downloads Forecast
- Premium Video Streaming Downloads
- Video Streaming Downloads by Region
- Video Streaming Downloads by App
- Short-Form Video Streaming Downloads by App
- TikTok Downloads
- Instagram Downloads
- Kwai Downloads
- YouTube Downloads
- Netflix Downloads
- Amazon Prime Video Downloads
- Disney, Hulu and Hotstar Downloads
- Twitch Downloads
- Crunchyroll Downloads
- Other US Video Streaming App Downloads
- China Video Streaming App Downloads
- Free Video Streaming Age Demographics
- Premium Video Streaming Age Demographics
- Video Gaming Streaming Age Demographics
- Free Video Streaming Gender Demographics
- Premium Video Streaming Gender Demographics
- Video Streaming Weekly Usage
- Video Streaming Weekly Usage by Country
- Video Streaming Usage by Format
- Video Streaming Time Spent
- Video Streaming Time Spent by Country
- Video Streaming Savvy Switchers
- Video Streaming Conversion and Install Rate
- Video Streaming Retention Rate
- Video Streaming Activation Rate
- Video Streaming Reactivation Rate
- Video Streaming Average Subscription Price
- Video Streaming ATT Opt-In Rate
- Video Streaming Refund Rate
- Video Streaming Sessions Length
- Video Streaming Number of Sessions
- Video Streaming In-App Response Rate
How does it work?
To get access to the Video Streaming App Report – Research, Insights and Statistics hit the buy now button above. After payment you will be taken to the download page to access your Video Streaming App Report – Research, Insights and Statistics PDF. If you need any help email data@businessofapps.com.
We have joined Treeapp, an incredible organization dedicated to reforesting the world. They will plant one tree for your data report purchase.
What our customers say about our reports
“Your report gave us some very useful insights on app statistics. As we are starting to develop apps it’s crucial information”
“This report is great work, it helped us get a better understanding of revenue and growth to include it in our analysis for LatAm. It has been very useful.”
“We have found Business of Apps data to be most accurate and complete on the web.”
“All the metrics and KPIs I was looking for are in one document for a very good price. The report was exactly what I expected.”
"There was an abundance of excellent information in the report, well worth the money. There were areas which had information I haven't seen anywhere else."
"Money well spent as far as I am concerned. A clear, well-written report"
“What a great resource!”
"This data has been a huge help for us launching our dating app"


