
As you already know, we always work hard to deliver you as much data as possible, so that your web and mobile analytics are the most accurate. As part of this release, we’ve introduced several new features that, if used together – or separately – will significantly improve the quality of your analytics. In this post, we’re going to try to cover a few bits and pieces about each of the features and illustrate how they can be used in practice. Analytics, marketers, and the whole development team are likely to benefit from these features on a real-world basis.
Trended funnel views: our answer to all your questions about conversion
It’s not uncommon to see marketers picking the brains of other marketers when it comes to conversion rate fluctuations. As you know, conversion can be a tricky thing to do: it may peak when you don’t expect it to; it may drop out of the blue, too.
Occasionally, it’s relatively easy to identify why conversion rates are skyrocketing. Alternatively, you may have some useful information regarding dropping conversion rates that can be helpful as well.
What if there was a way to avoid this pesky conversion problem? Smartlook has been working on just that for you. Our product is always looking for solutions, and they have found the answer in new features that’ll help you grow your business exponentially.
Say hello to trended funnel views
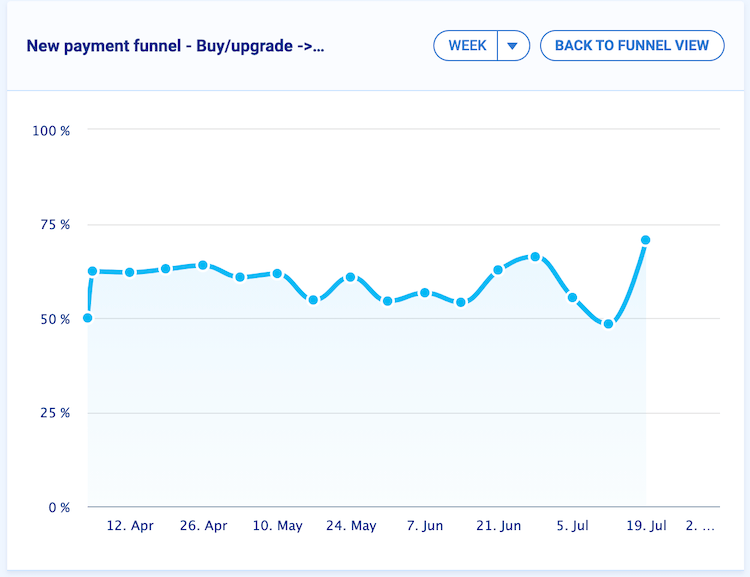
With trended funnel views, you can filter time periods to see how conversion rates have changed over time. Then, you can use such knowledge to:
- identify the peaks in your performance (was it connected to the launch of a new feature, or maybe that was caused by a promotional campaign you have recently launched? Until now, it could’ve been nothing but guesswork for you)
- find out why and where your users drop from the conversion funnel – and have a solid basis for finding a reason why they keep doing so
- match your existing data points with each other and draw actionable conclusions
- streamline the checkout process and simplify various processes in the customer journey
- verify what else can be done to improve buy/upgrade ratio – and how the said ratio looks at the moment, on 1 single graph
- observe seasonal trends and adjust your overall business strategy to match them
- track anomalies and their behavior over time
As you may know, Smartlook lacked the ability to measure funnel conversion over time. Until now, this couldn’t be done. By introducing this new update, we hope that eliminating – or avoiding – conversion dilemmas will be much easier for all our users.
#2 new interactive player
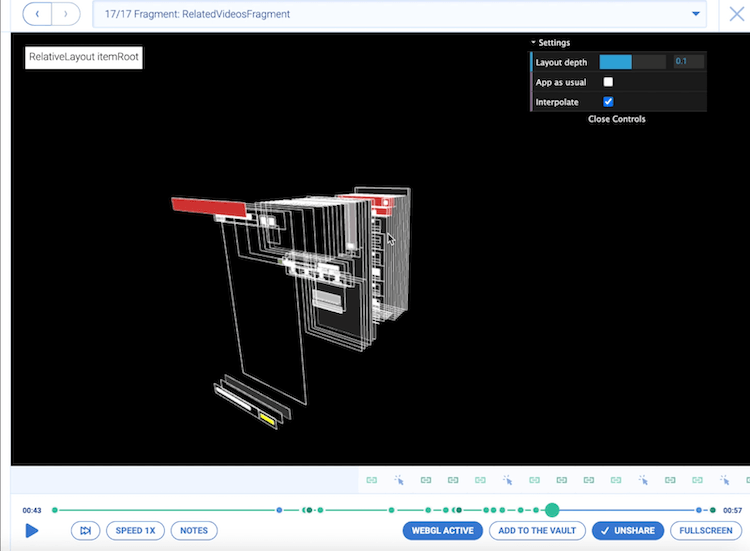
Now you can also explore the new interactive player for mobile projects.
The new feature will allow you to:
- inspect the structure of an app in a similar manner to the Layout Inspector in Android Studio or the View Debugger in Xcode
- view user sessions in 3D or 2D, as in our wireframe mode
- analyze complex view structures with detailed debug info
We recorded a short presentation to our YouTube channel to further explain what makes our new interactive player so useful.
This will give you a bird’s eye view of your app and all its different aspects, in a way that traditional representations won’t, but at the same time, you can look into minute details, too.
Right from the app, you’ll be able to see real-time interactions with your app in 2D or 3D, showing you which elements your app users interact with the most and which get skipped. If you want to build sleek, intuitive user interfaces for your mobile apps, no other representation will give you this much actionable insights in 1 convenient place.
In a situation where it’s not possible to record the screen, or when you wouldn’t get accurate data, the 2D and 3D view are there to help you.
Instead of representing the actual image, Smartlook draws a sketch image instead of copying the content directly in the video. You’ll still be able to understand what’s on the screen, but you’ll get laser precision when analyzing what the user tapped on during their sessions.
For example, traditional session recording will only reveal what the user is viewing, but this mobile app view will show you how they interact with individual elements in 2D or 3D views.
At the moment of writing, this feature is only available for native Android SDK, while support for iOS is coming soon. Along with this, we’re planning to launch some new features in the near future, including creating events and navigating your funnels directly from the interactive player.
Session vault for better analytics’ asset management
There is no way to avoid the fact that data points are increasing in volume when you run a business at a particular scale. The process of organizing them can be challenging and quite time-consuming, especially if there are no plans or procedures through which you can accomplish this task.
In order to meet your demand and expectations, Smartlook introduced a new feature called session vault, available only to the “Business” package users.
With the session vault features, users will be able to back up all their sessions for as long as they please, having them accessible at all times. The recordings are moved to permanent storage where they can be reviewed and watched whenever the situation requires.
Session vault will not only help you with analytics per se but also with the organization of your analytical assets. As the recordings are all available in 1 convenient place and there is no deadline after which they expire or become inaccessible, your analytics can be enhanced at any time.
This feature supports storing and protecting recordings that contain valuable information indefinitely – so you can always come back to them.
All that you’ll need is in 1 convenient place, now – no more wasting time with multiple programs, saving your recordings out of Smartlook, or simply watching them go away, forever.
Active users tile to get you more insights on your customers’ behavior
Do MAU, WAU, and DAU sound familiar to you? We’re scrambling to find out what these acronyms mean, as they stand for Monthly Active Users, Weekly Active Users, and Daily Active Users. As well as demonstrating the performance of your business processes and indicating bottlenecks in the process, these metrics are an essential part of the analytics for your business. The more data on your users you gather on a regular basis, the better insights for further development and growth you’ll have. Without data, it’s nothing but guesswork.
And now, you can quickly get familiar with these metrics in Smartlook: we’re introducing a new feature called active users tile. By tracking active users, our customers can improve the accuracy of their analytics even further. By seeing them in a larger perspective, for instance, a specific day, week, or month, you can get a better understanding of what your strategy should be. In the active users tile feature, you’ll see monthly, weekly, and daily active users plotted in column charts.
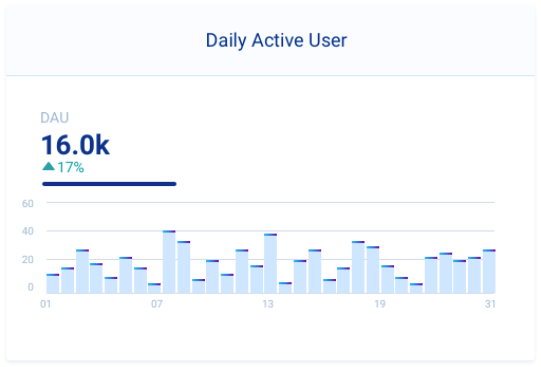
In addition to being easy to read and understand, the column chart simplifies drawing conclusions and observing trends. If you wish to compare values from different time periods, hovering over a particular column will show you the exact value.
The active users tile feature can help you with:
- analyzing the effectiveness of your marketing campaigns (on default, they should bring more traffic – is this happening? Can you see more daily active users straight away when the campaign is launched?)
- identifying times when your users are active (e.g., you can see that your users are most active over the weekend, which can give you insights into 1) intensifying your campaigns in that period to leverage it even more, and 2) improving your campaigns over other days to balance the results)
- checking the areas for improvement for your strategy needs
- observing growth trends below the exact value, you’ll also see either an increase or decrease in a percent value (%), in comparison with the previous period
We plan to launch the active user tile feature very soon – stay tuned to our social media channels not to miss the launch.
That’s all folks
…or is it? Those are not all the features we’ve recently published within Smartlook for mobile and web analytics – and definitely not the last ones to be introduced in 2021!
You might want to take a look at our anomaly detection feature, which can help you improve your analytics and prevent you from making mistakes.
It’s extremely important to us that you might want to provide us with any feedback – we value it highly, so let us know what you think about our new features and how else we can improve the Smartlook dashboard for you. We’re all ears!
Are you ready to get started? Sign up today for a free trial, to see what Smartlook can do for you and your business.