

Through active efforts, developers have made continuous advances in their abilities to develop better products in 2022. With improved products and upgraded marketing strategies, the mobile game and app market in 2023 will be featuring innovation and full of challenges. So, SocialPeta published its 2022 Global Mobile Game & App (Non-Gaming) Marketing White Paper, providing insights into global marketing and product globalization.
This white paper of nearly 200 pages comprises two parts: mobile games and apps (non-gaming), which is an integration of industry insights from dozens of companies including Singular, Tenjin, Digital Turbine, Moloco, Storemaven, AdQuantum, Udonis, Mobidictum, Apptamin, and AppROI. It provides you with a precise analysis of industry data in 2022 and with forecasts of future trends, based on global mobile marketing data, observation of popular regions, precise channel advertising, advertising budget cost, and popular mobile game analytics for marketing.
Mobile games
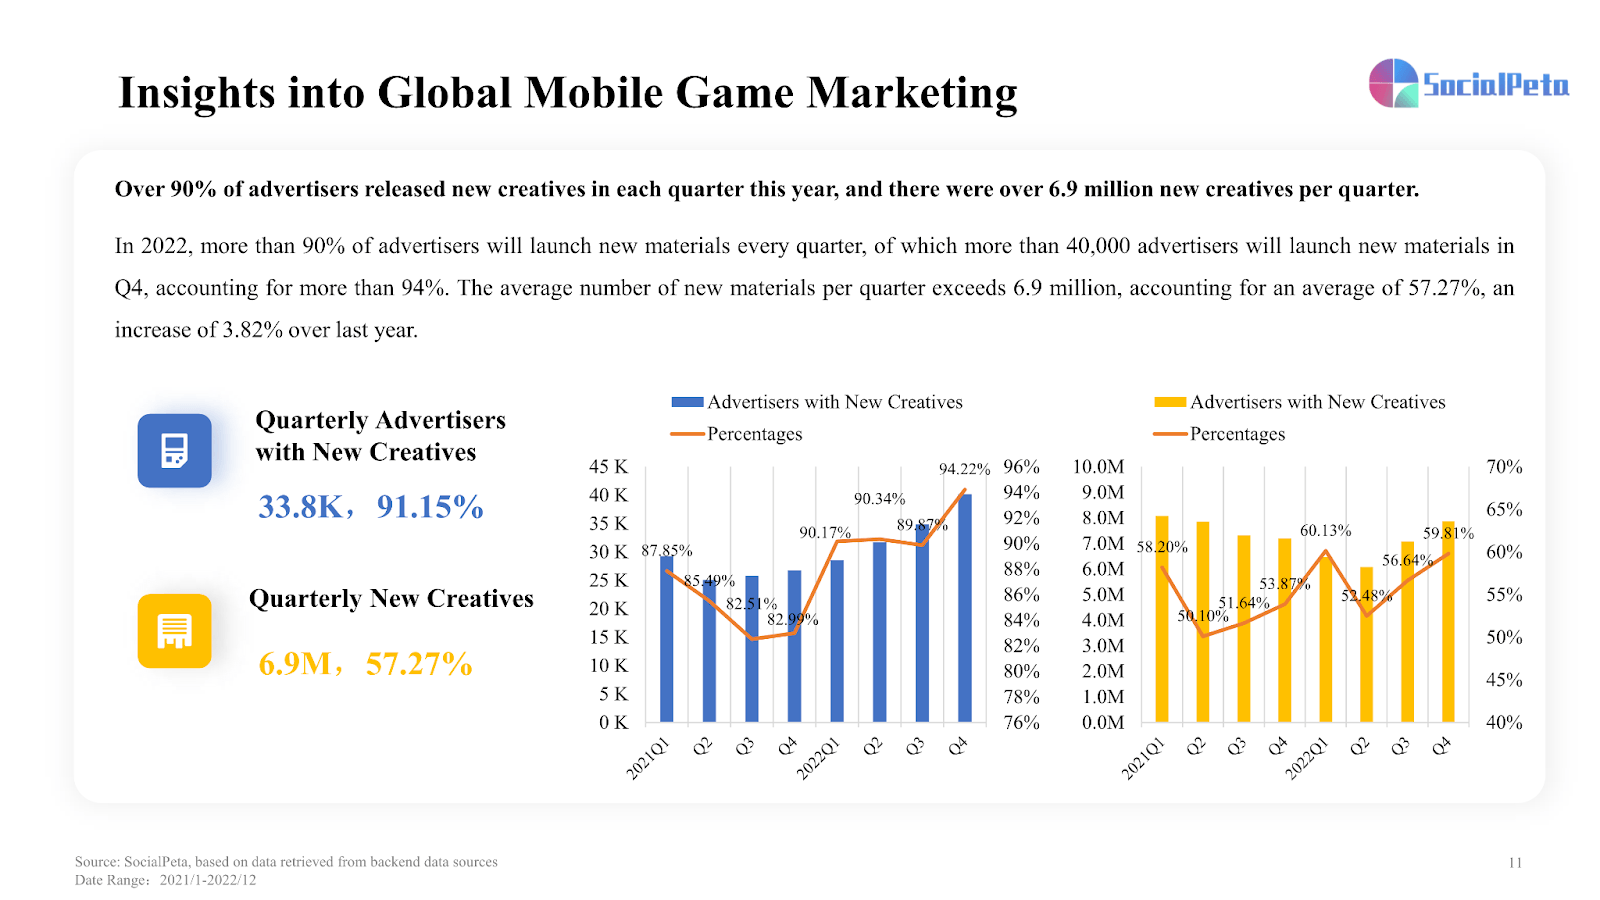
Global data overview: Marketing focus switched to high-quality and innovative creatives.
There was an increase of 17.5% YoY in quarterly advertisers and a decline of 16% YoY in quarterly creatives. Over 90% of advertisers released new creatives in each quarter, with an increase of 3.82% YoY in the average number of new creatives per quarter.
Click on image for full size
Source: SocialPeta
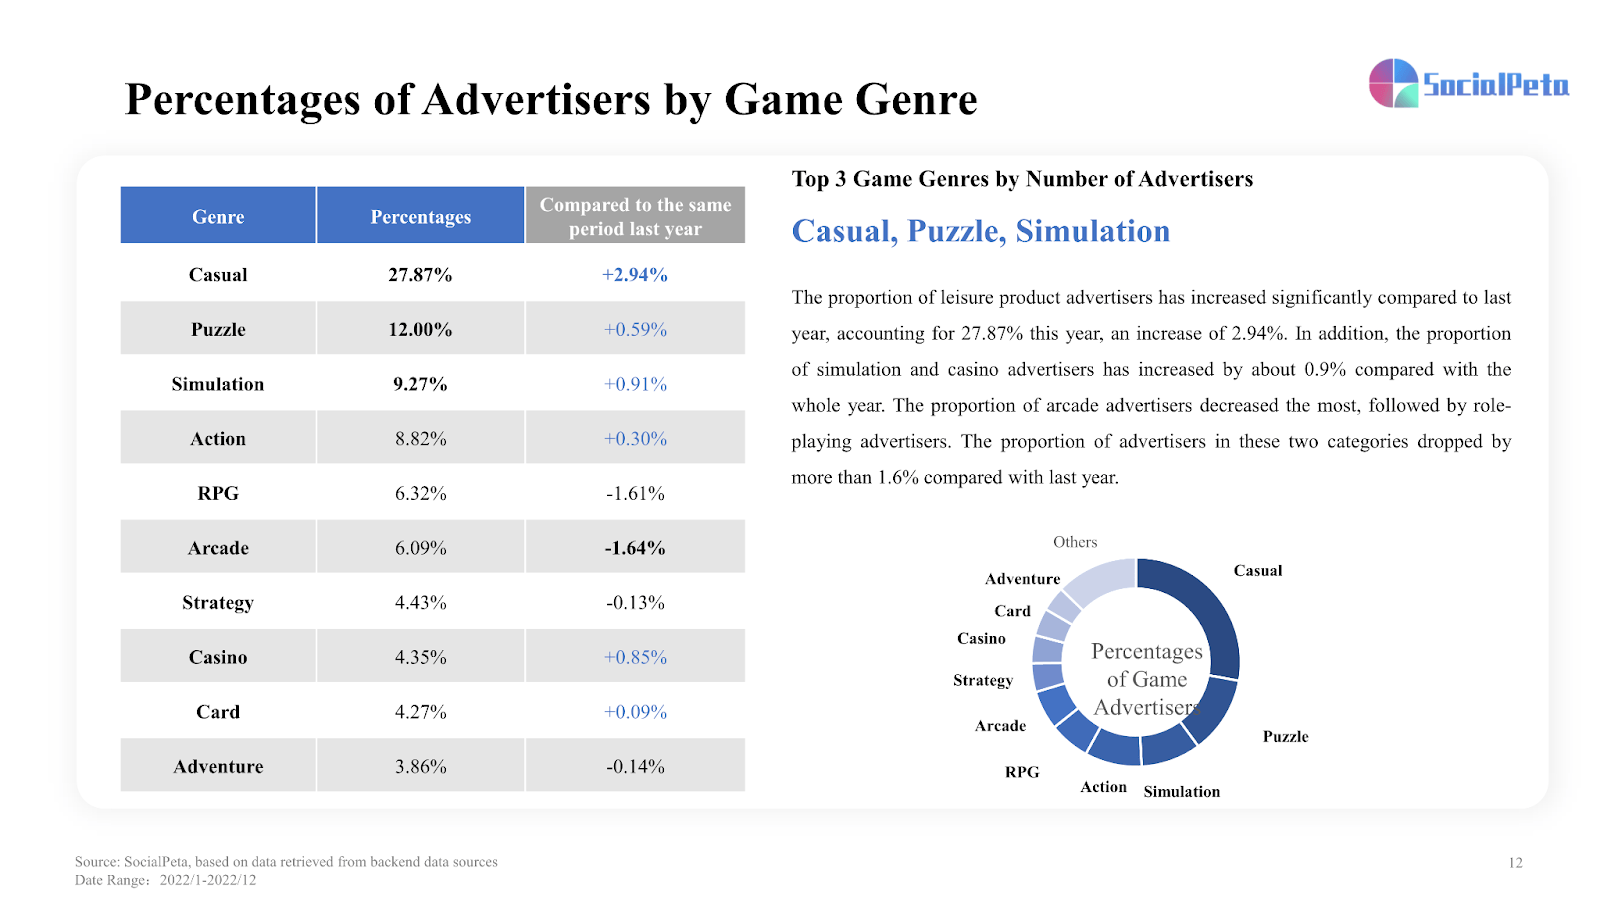
In terms of game genres, casual game advertisers accounted for a bigger share of all game genres, rising by 2.94% YoY. And, there was an increase of about 0.9% YoY in the shares of simulation and casino advertisers.
In terms of creatives, casual game creatives accounted for the largest share of 22.69%, rising significantly by 4.74% YoY.
In terms of regions, North America remained the one with the highest number of monthly advertisers, while HK, Macao & TW and Southeast Asia saw monthly creatives above the global average.
Click on image for full size
Source: SocialPeta
Market analysis by country
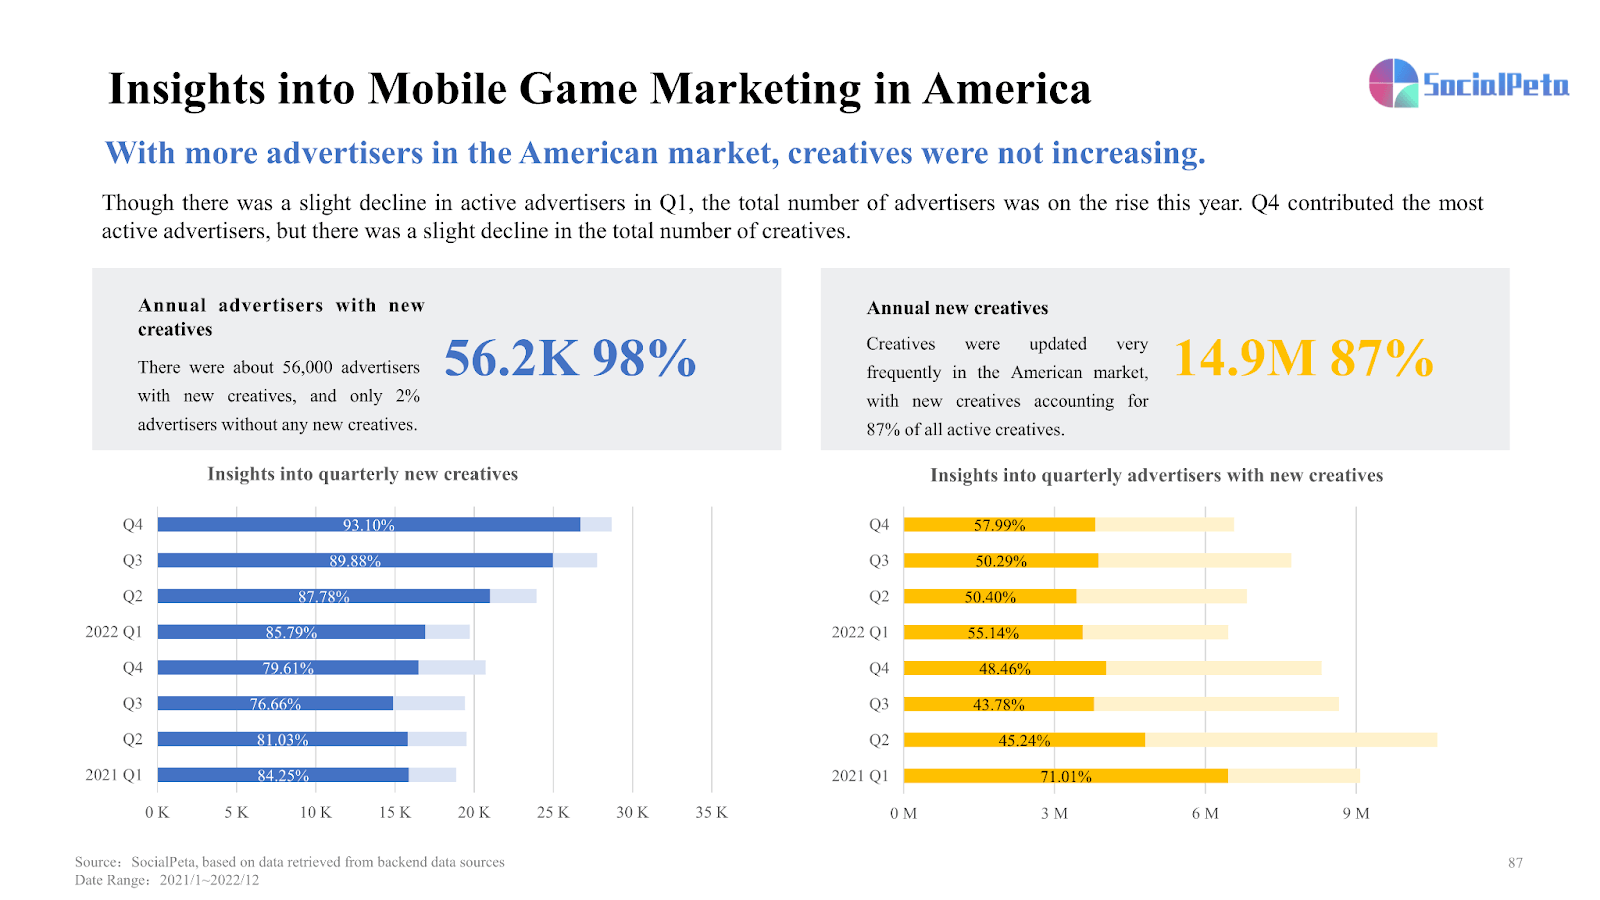
American market remained incremental
The overall American market was on the rise. Creatives were updated pretty regularly to have 87% new creatives of all active creatives. Active creatives for casual games accounted for 24.98% of all creatives, representing a significant increase of 5.22% YoY. In terms of active advertisers, there were increases in casual, puzzle, simulation, and action games, with casual game advertisers accounting for the biggest share of 30.28%.

Click on image for full size
Source: SocialPeta
Vietnam: A big rise in casual game advertisers
This year saw 93% of game advertisers with new creatives and only 7% of advertisers without any new creatives, showing a high frequency of updating creatives. There was an 8.83% increase YoY in casual game advertisers, a slight decline in simulation game advertisers, and a small increase in the shares of arcade and action game advertisers. Casual and puzzle games remained dominant with their active creatives accounting for the biggest and second biggest shares.
India recorded the highest but also dramatically dropped DAU.
India had the highest DAU among all countries, accounting for 5%, but also reported the sharpest drop in DAU compared to last year. The Indian mobile game market generated as much revenue as it did last year.
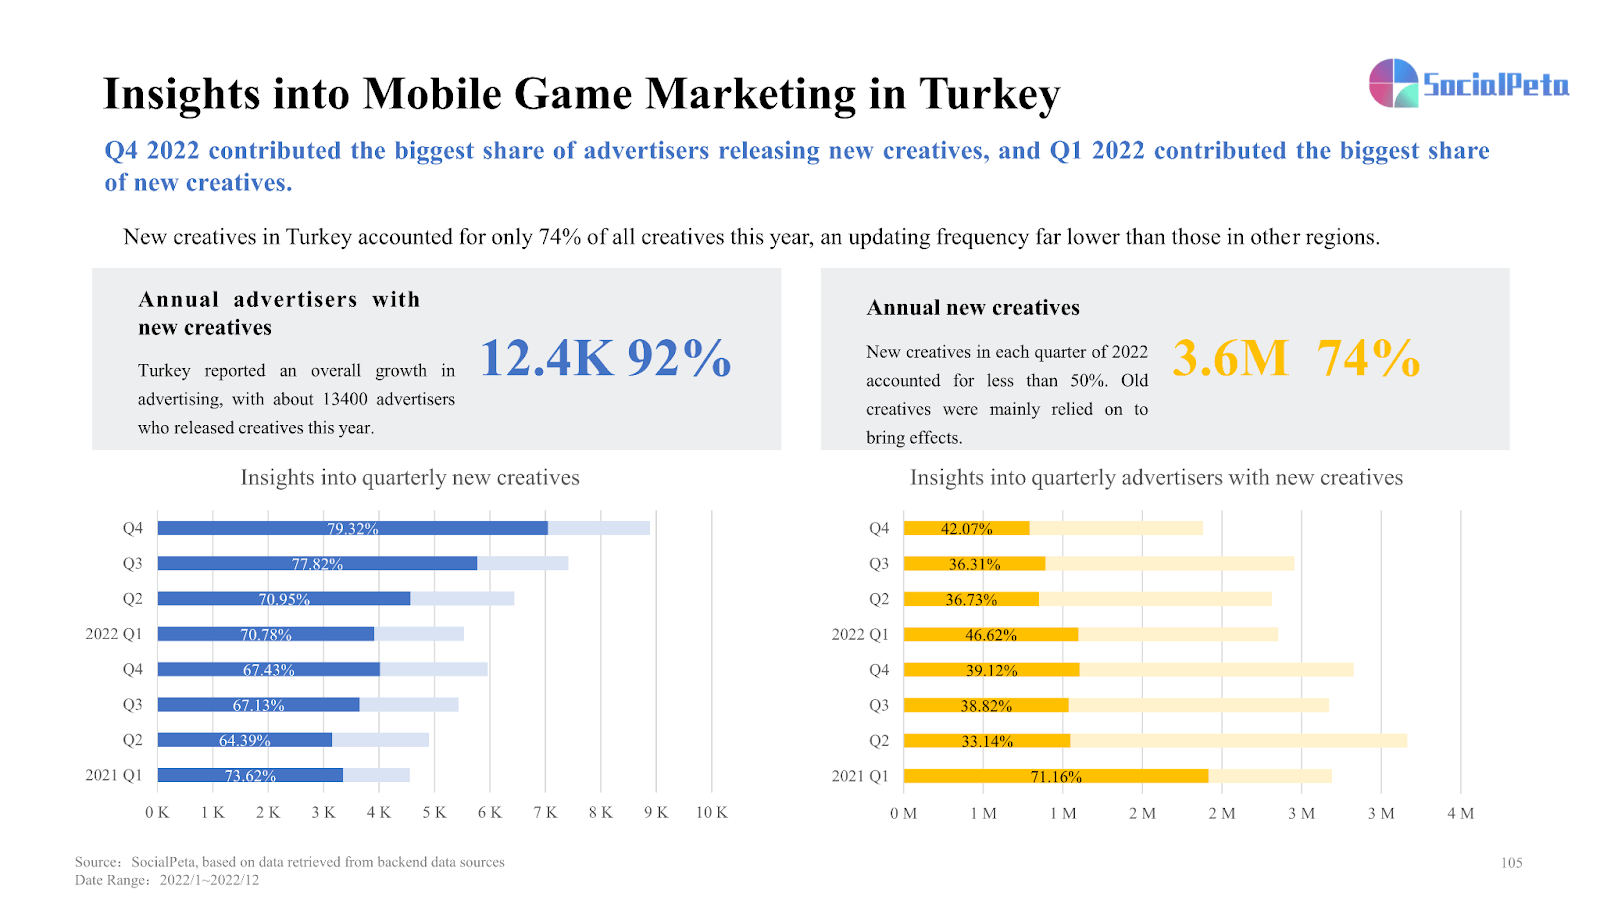
Turkey: The highest share of advertisers with new creatives in Q4
New creatives accounted for only 74% of all creatives this year, an updating frequency far lower than those in other regions. Casual game advertisers accounted for about 29.88%, up 8.63% YoY. RPG advertisers and active creatives both recorded the greatest declines.
Click on image for full size
Source: SocialPeta
Trends of creatives
Strategy mobile games: With a little innovation in gameplay, strategy SLGs focused on art and subjects and released “Casual + X” creatives.

Click on image for full size
Source: SocialPeta
Casino mobile games: Gameplays were displayed to attract attention and scenes of winning prizes were shown to further intrigue people.
Non-gaming Apps
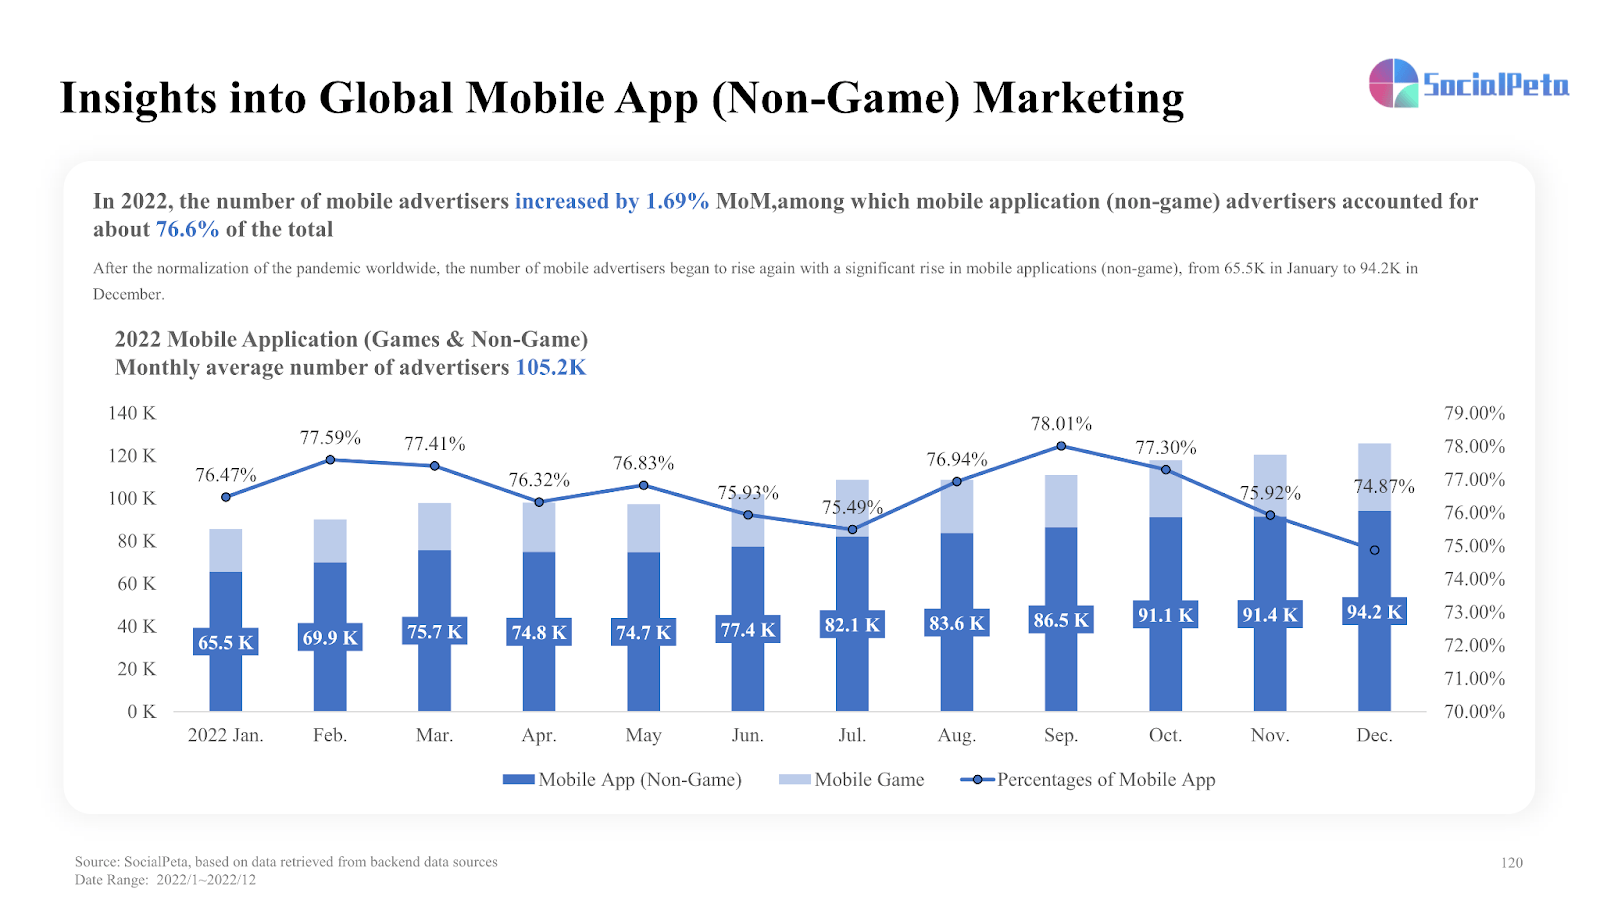
Global data overview: The number of mobile advertisers rose again, and there was an increase in mobile applications.
Overall, in 2022, the number of mobile advertisers increased by 1.69% compared with that in 2021, among which advertisers accounted for about 76.6% of the total.
Click on image for full size
Source: SocialPeta
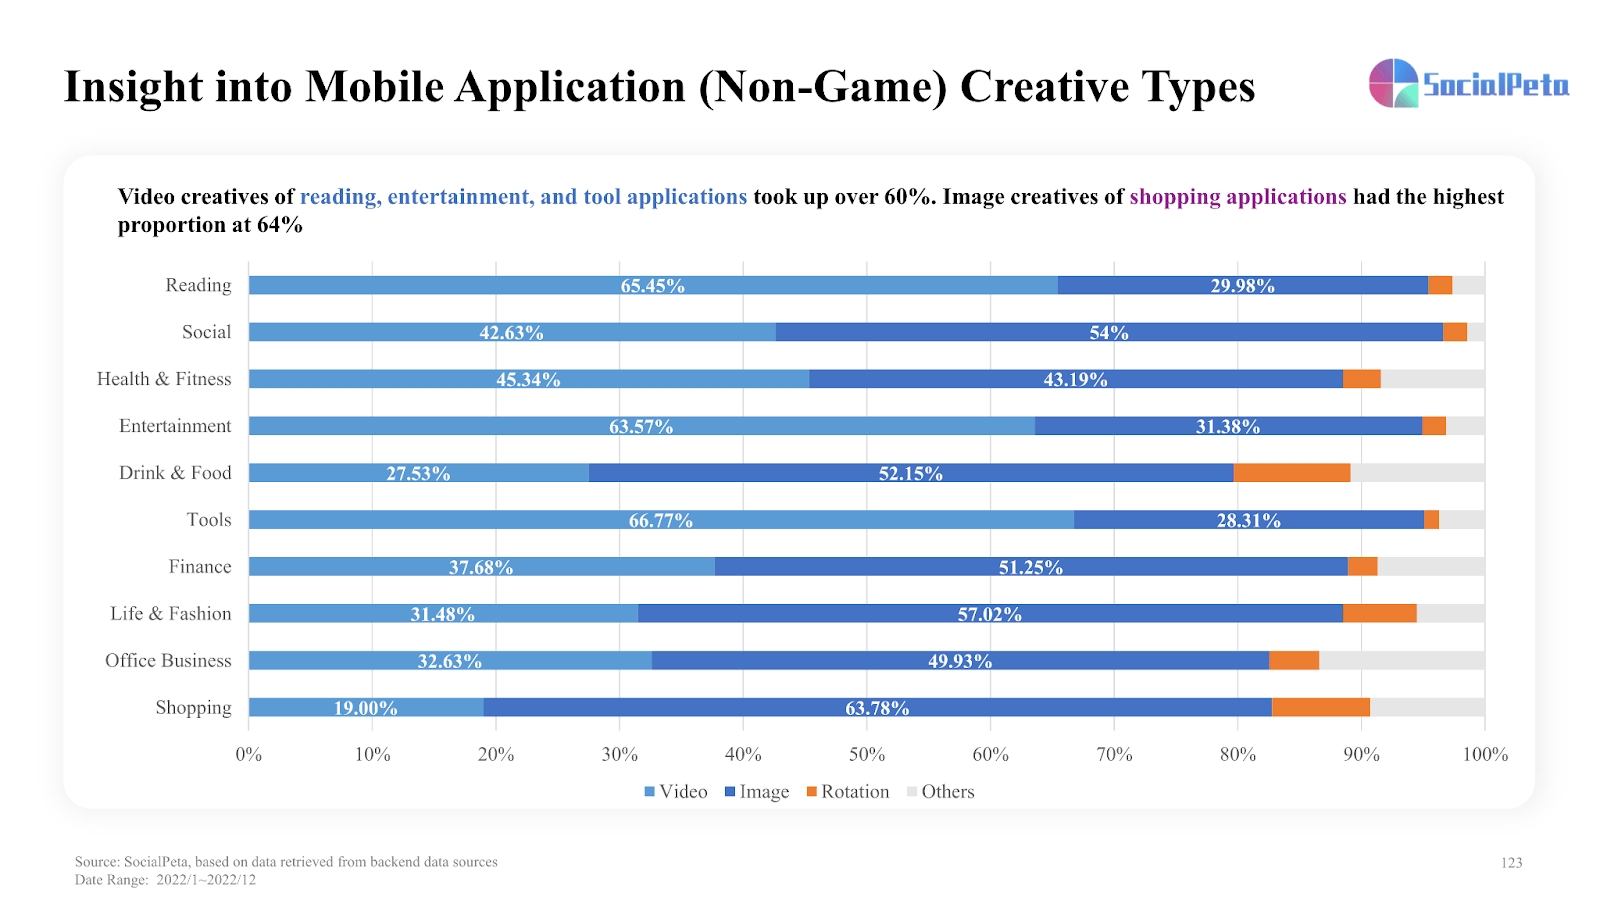
In terms of the monthly average number of creatives, reading, social, and tool applications were still among the top three.
In terms of the types of creatives, video and image creatives held a dominant position, among which reading, entertainment, and tool applications took up over 60%.
Click on image for full size
Source: SocialPeta
Marketing insight into popular regions
North America: Fierce competition in advertising
In 2022, 97% of the advertisers in North America released new advertisements, among which 90% were new creatives. Tool applications increased significantly. The numbers of advertisers and active creatives increased by 1.37% and 6.48% respectively compared with those in 2021.
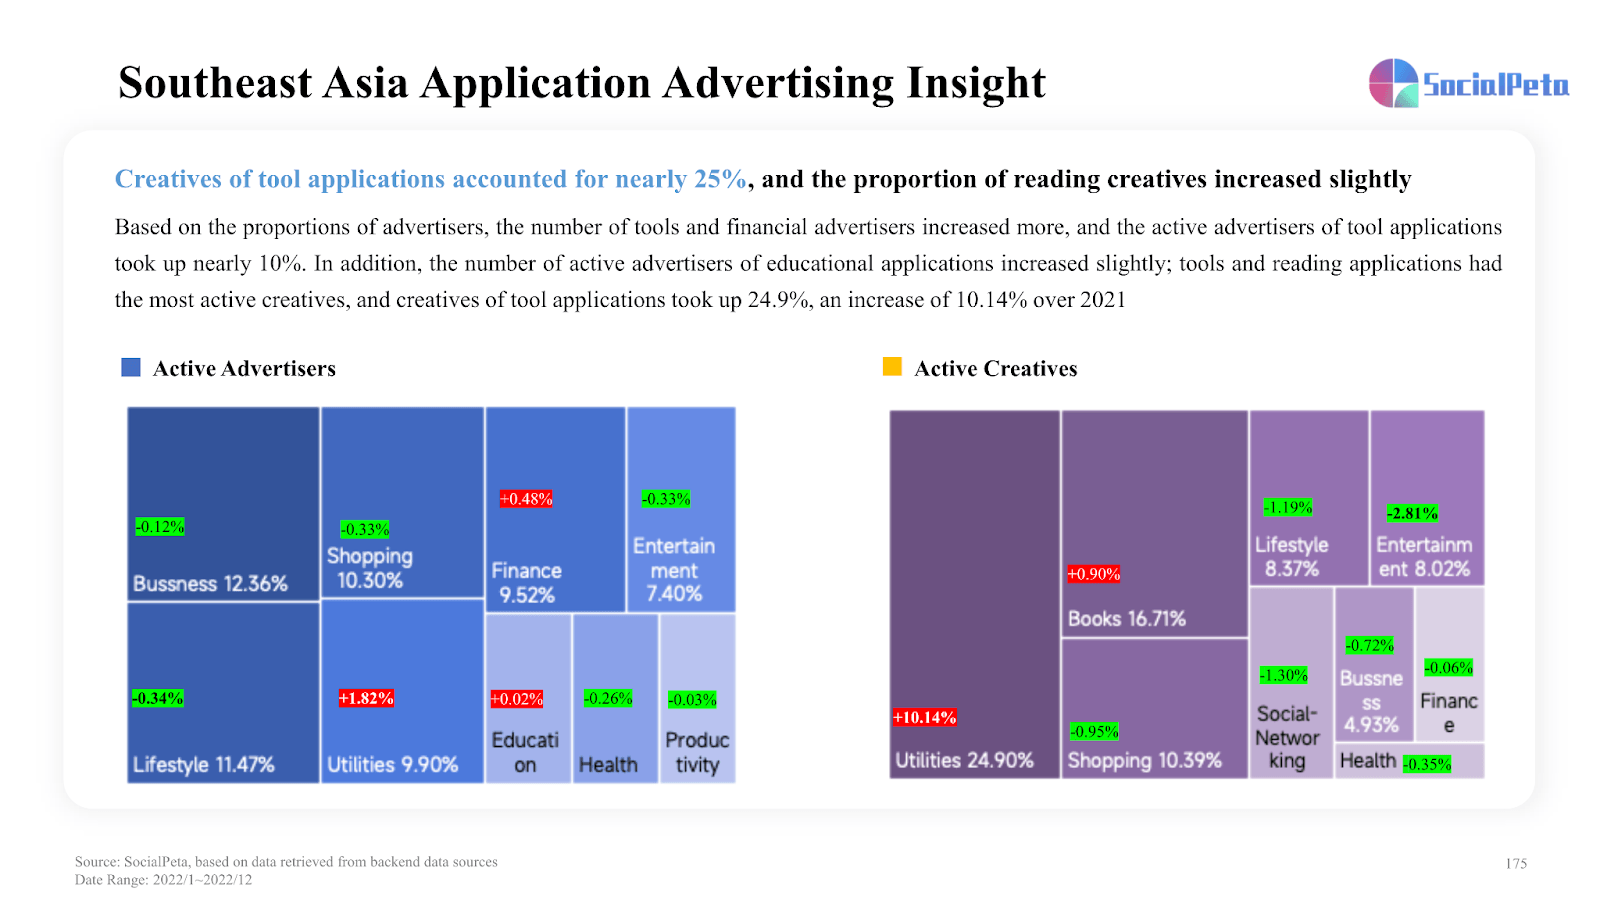
Southeast Asia: Creatives of tool applications accounted for nearly 25%
The number of tools and financial advertisers increased more, and the active advertisers of tool applications took up nearly 10%. Tools and reading applications had the most active creatives.
Click on image for full size
Source: SocialPeta
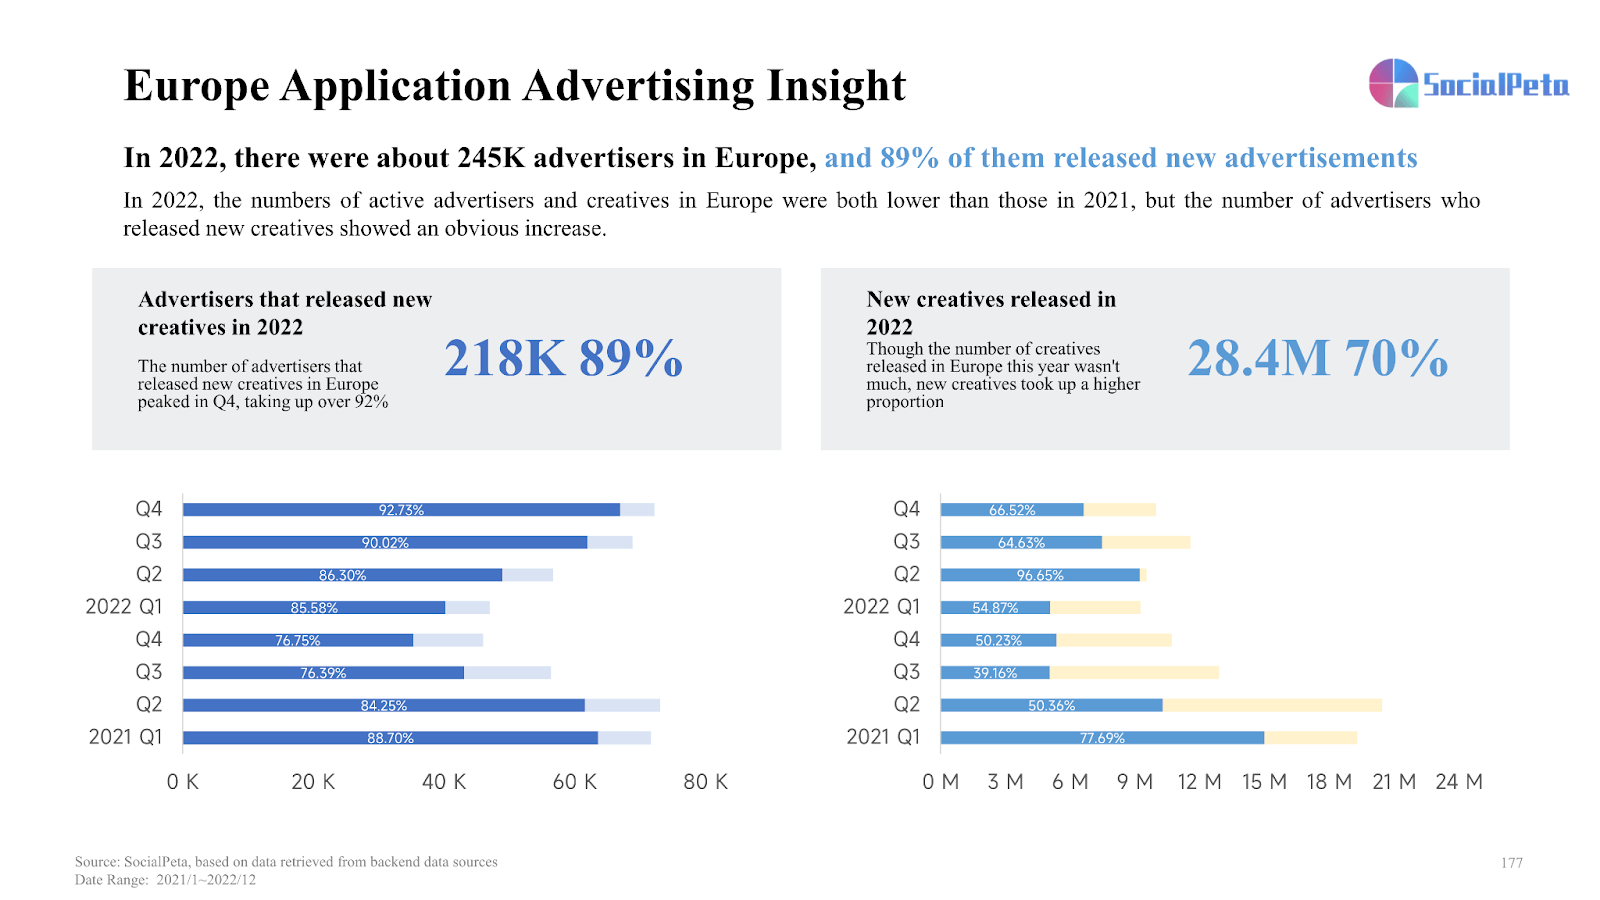
Europe: The proportion of active creatives of travel advertisers was slightly higher than that in other regions
In 2022, the numbers of active advertisers and creatives in Europe were both lower than those in 2021, but the number of advertisers who released new creatives showed an obvious increase, among which 89% of them released new advertisements.
Click on image for full size
Source: SocialPeta
Trends of creatives
Tool applications: Baked into daily life. Show products’ advantages by comparison and twist.
Entertainment Applications: All applications have distinct features that can show their competitive edges.
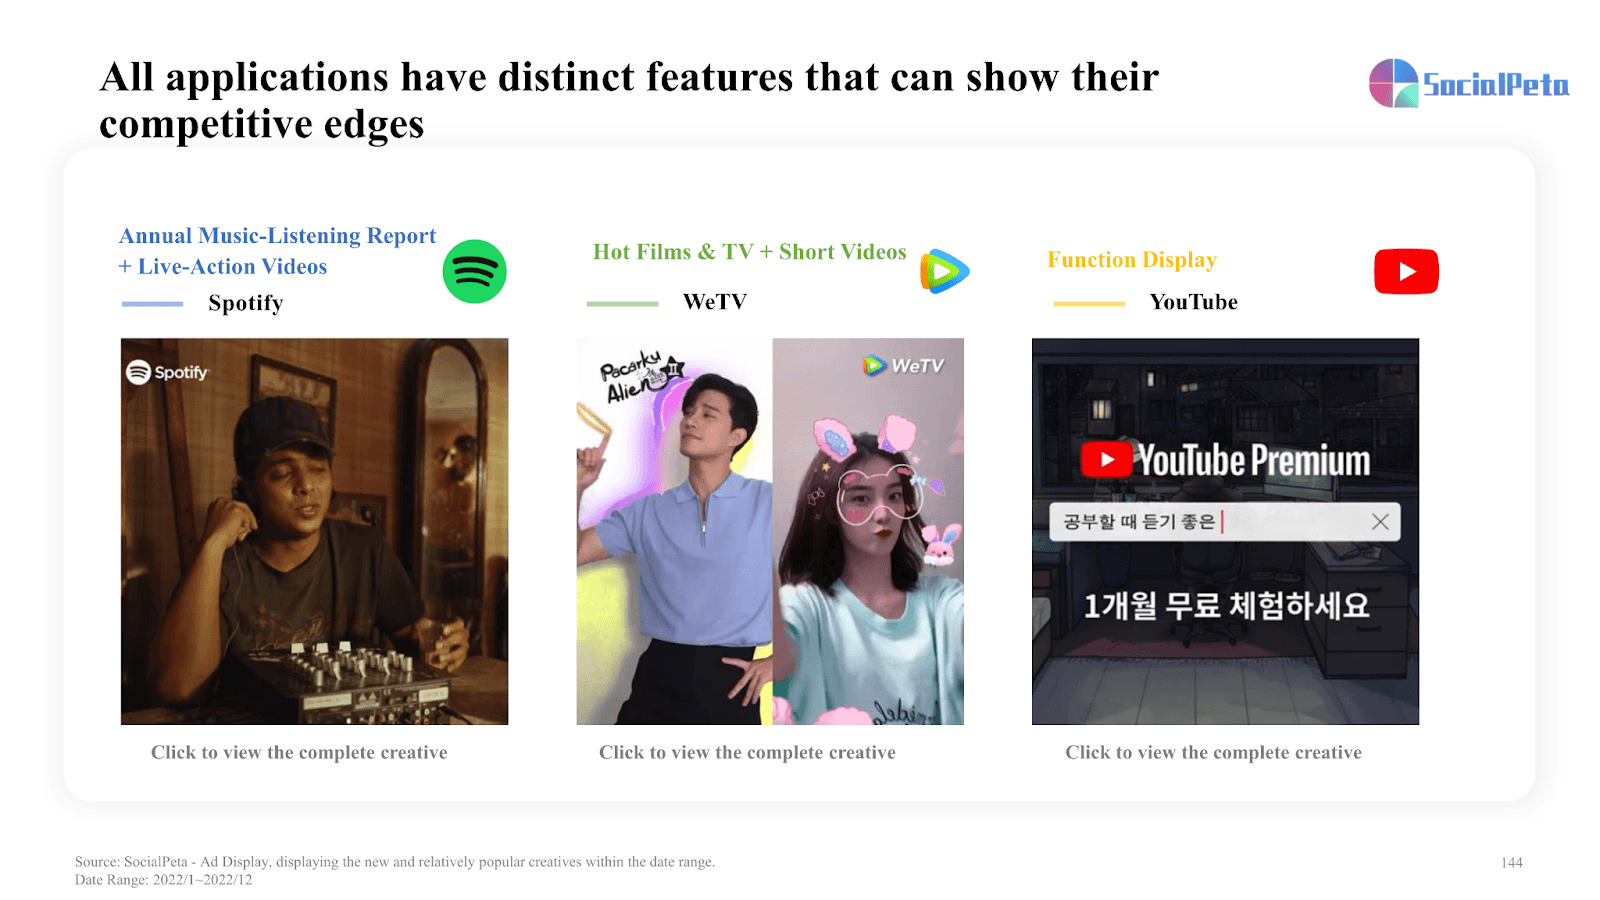
Source: SocialPeta
Social applications: Emphasize the attraction of beautiful things, ideal life, and a broad horizon.
Industry trends
Digital Turbine – User acquisition through traditional methods is getting more expensive and continues to be problematic in its complexity – why are we still expecting users to take multiple hops and steps simply to download an app? Developers should look to solutions that allow consumers to skip the store and have a more frictionless UA experience.
MOCOLO – We expect the average number of creatives used in a given campaign to increase in 2023, with marketers becoming more proactive about fighting and fatigue.
Storemaven – We recommend starting to start thinking with a more data-driven mindset for 2023, with the end goal of maximizing ROI and enjoying higher profits for your business.
Singular – How can app marketers scale their user acquisition in 2023? Singular gathered three key tips to answer that precise question:
- Go beyond D7 campaign performance
- Story-telling is the new targeting
- Pick an MMP that provides you with accurate marketing ROI
Getting the right data the right way right away is critical to mobile user acquisition. Innovation matters. Combining cost and conversions matters. Smart modeling for missing data matters.
Conclusion
The data in this report covers nearly 70 countries/regions worldwide, with over 70 mobile marketing platforms at home and abroad, providing over 1.2 billion mobile marketing creatives. If you want to learn more about the mobile gaming&app industry in 2022 and understand the coming trend of mobile games&apps and the market in 2023, click here to obtain the full white paper.