
Navigating app product analytics is like treading uncharted waters. It’s easy to get overwhelmed in the vast sea of data insights, but knowing what data is most valuable for your company can chart the course to success.
This comprehensive 7-step guide will help you navigate through the intricacies of mobile app product analytics, steering you away from the overwhelm and toward the smooth sail of informed decision-making.
Discover how to harness the power of your app analytics platform as we delve into each step.
Treat data security as your North Star
The North Star of app analytics is data security. When dealing with large quantities of data – especially personal data – its security should be the first point to navigate through in your product analytics checklist.
To ensure smooth sailing, look out for these factors in your product analytics platform:
Ensure your analytical platform holds certifications in industry-leading data standards, like ISO, GDPR, and CCPA, COPPA.
Apart from checking these logos on a platform’s website, you can go the extra mile and request copies of those certificates for your team to authenticate. Although this can be a seemingly meticulous step, it guarantees that your data is safeguarded by recognized and stringent standards.
Verify that the code of the platform is shared via open source.
Even if you cannot verify all the code by yourself, the fact that it’s shared publicly reduces the risk of hidden traps and sets sail for a trustful partnership with the platform.
By implementing these two foundational steps, you can set up a robust data security framework for your success in app analytics.
Check the UI: how easy is it to navigate?
A key factor in the successful implementation of an app analytics platform is its usability. If you’re investing in a platform that promises to simplify your app data analytics, all your team members should be able to use it without too much effort.

So as you explore your options for an app analytics platform, ask yourself:
- Can I easily navigate my data analytics?
- Can this platform serve as a compass, guiding me to where I need to go for more information?
- Is there a proper onboarding structure to help my team learn the platform from day 1?
- Is there too much information on one screen?
- Is there a hierarchy?
- How fast is the platform operating? Is the speed satisfactory?
To illustrate how much an intuitive UI can impact productivity, consider the case of A1Apps, where the team found AppMetrica so user-friendly and effective that they integrated it seamlessly into their operational processes across the entire business.
App analytics platforms provide us with a lot of data. And complex interfaces only make things worse. A streamlined and user-friendly interface will not only enhance the overall experience of your team but will also motivate you to utilize the platform to its full value.
Identify the product insights you want to see from the reports
In the expansive ocean of mobile data analytics, product insights can serve as a lighthouse of sorts, setting your course of business direction. An ideal app analytics platform should intuitively drive you to these insights.
Start with identifying the specific product insights you wish to learn from your regular reports in the first place. This is a pivotal step: you want to recognize the metrics that matter for your organization and ensure that the chosen analytics solution can adeptly track them.
Examples of insights to look out for include:
- User Acquisition metrics
- Cohort analysis
- Funnels
- Retention and engagement
- Crash and error reports
- LTV and Churn predictions
- Revenue analytics
- And more
AppMetrica stands out in this regard, offering a plethora of features, from tracking user engagement and retention rates to analyzing in-game commerce and predicting user lifetime value (LTV) and churn. Learn more here.
Outside of generating regular reports, your platform should also help you keep your hand on the pulse by showing you abnormal trends in your application. For example, if you have released a new version of the application and the time spent decreased, AppMetrica will send you an immediate notification about it: you can choose to study the report closer or ignore it.
Tracking user engagement
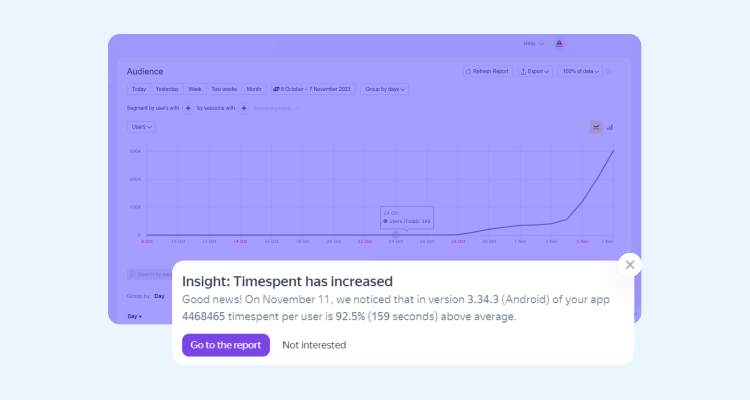
Source: AppMetrica
Explore what features can be helpful and complement your key metrics
Crash and error reports
To get a full picture of your product analytics, it’s important to track events that dramatically influence your app’s monetization – like crash and error reports. You don’t need to be a developer to see when something goes wrong with your app. Your app analytics platform should inform you if something goes wrong as soon as possible and provide you with all the relevant data to analyze and fix the source of the problem.
A/B testing
A product manager’s key job is to make data-driven decisions, and what better way to do that than by running A/B tests? A/B tests are a true scientific way to help you prove or reject your hypotheses. Not only do they save your company’s budget and prevent costly mistakes, but also make it easier to back your decisions (and stakeholder presentations) with hard data and proof.
Consider an app analytics platform that will enable you to seamlessly implement at least two A/B tests. In the case of AppMetrica, this feature is available for all subscription plans as a ‘must have’ for every app manager.
Remote config
What do you do when you finish your A/B tests? That’s right, start implementing changes! Remote configuration feature in AppMetrica allows you to configure your app using Flags without the need to release a new app version every time (and risk creating errors). By configuring your app via Flags, you can quickly optimize your app based on your A/B test results and see improvements in app performance as soon as you click “go”.
Exploring new features
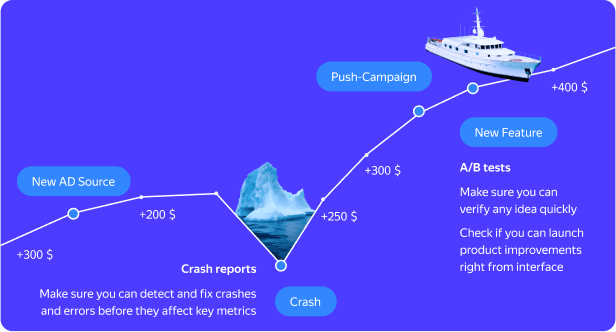
Source: AppMetrica
Predictive analytics: Сatch big fish with big data
It’s no secret that AI is changing the world around us, so why not use it to our benefit in app analytics? A new development in the world of big data is predictive analytics. Features based on ML models employ artificial intelligence to analyze massive amounts of user data – like their engagement and events in apps – and make accurate predictions on their behavior in your app in the future. Having this data on hand enables app managers to optimize ad campaigns and get the most out of their best-performing ad channels with minimal resources.
One example of an AI-based feature is AppMetrica’s LTV and Churn Predictions. This newest development on the platform allows you to maximize your ad campaign performance to get more high-paying users AND predict which current users are about to churn so you can take action in retaining them.
LTV predictions have proven to be a more effective optimization strategy based on several internal A/B tests. In a case from Yandex.Games – a major mobile app developer and publisher – the team tested two optimization methods:
- Optimization based on the “User played for at least 10 minutes” event
- Event-based optimization based on the predictive model for the top 20% of paying users (top20LTV)
Though the campaigns were identical, the predictive model attracted more engaged users without changing their costs. App usage time increased by an average of 10.5% and ad views from users who were attracted to the model generated more revenue in the first week after installation than views from users who were attracted to the previous approach over the same period. This trend continued in the following two weeks.
AI instruments in app analytics are becoming instrumental in maximizing revenue while saving the company’s ad budget.
As you evaluate available AI-based features, check them for several components:
- Accuracy of predictions
- Speed of forming these predictions
- Output and presentation
An AI-based tool or feature that meets these criteria will become your first mate in navigating the vast ocean of predictive analytics in app management.
Check you have access to your app’s raw data and export
App analytics platforms are great in reworking your app’s data into user-friendly reports. But behind those graphs is raw data about your app’s lifecycle – data that you own. Whether you are working with a SaaS app analytics platform, a complex BI system or both, it’s crucial to have easy and fast access to the raw data.
There are 3 criteria the platform should meet:
- Raw data download should be simple – you need to be able to integrate analytics into your ecosystem easily.
- There should be no export limitations or they must be adequate for your purposes.
- Import and export speed should be high. If you are waiting for data for 2 days, it’s not efficient, as you’re not able to have control over what’s happening in your own application.
Check the cost is accessible for you and your company
Finally, we can’t ignore the pricing aspect of your app analytics platform. Whether your company is a large enterprise or a new startup, the cost of the solution shouldn’t wreck your ship! In other words, it must align with the value it brings to your company and be proportionate to the growth of your app.
Moreover, the pricing plan should:
- Be flexible towards upgrades and downgrades, if needed
- Include a free trial or a demo
- Avoid long-term commitment
- Be transparent and easy to get approved with the company’s budget holders
In conclusion, the journey through product analytics mirrors navigating uncharted waters. The expansive sea of data insights can be overwhelming, yet understanding the significance of specific data points for your company becomes the compass to guide you towards success.
Unravel the potential of your app analytics platform and embark on a journey of mobile app data with AppMetrica: an all-in-one mobile app analytics platform that will take you through every step of the app management journey.