
With the total number of app installs falling and the recession scares looming, more and more app developers are becoming laser-focused on performance like never before. Anything that can’t prove its positive ROI gets less attention, and brand activities like influencer marketing are the ones getting cut from the budget. Coincidentally, bloggers never deliver the same cost-efficiency as user acquisition: their CPI is inevitably higher, and all other metrics go up together with the ever-rising CPM. For performance-focused developers, anything that can’t be tracked should be stopped.
However, short-term clenching never helped long-term growth, and branding activities are just one example. Unfortunately, “trust me, this will work” doesn’t always convince one’s colleagues and managers to keep the budgets flowing into seemingly less effective channels. That’s why it’s important to see the full picture and be able to predict the long-term effects of short-term campaigns. Complex attribution models were designed just with this idea in mind, but they don’t always deliver.
Q4 2022 Worldwide download growth
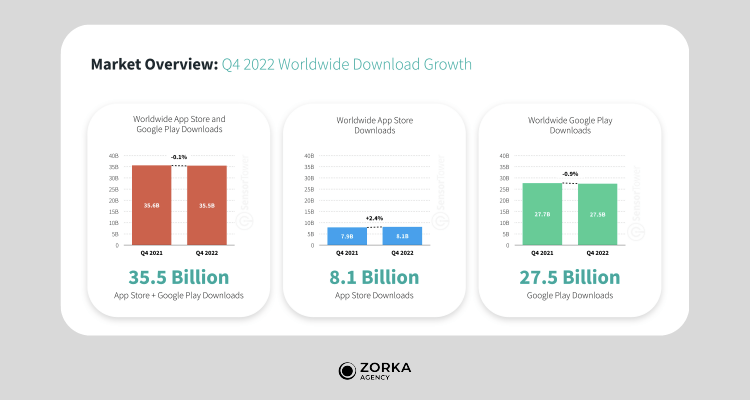
Source: Sensor Tower
Why current attribution models don’t always work
Attribution models try to collect information from several media and data sources and trace back the user from the crumbs he left along the way. With the abundance of ads and ad budgets, customers are always less likely to follow the direct click-to-install pipeline: most purchase decisions are the result of the accumulative effect of several brand touchpoints.
Most attribution models focus on the last touch, usually giving it the full responsibility for bringing in the user and calculating the per-channel ROI accordingly. This approach ignores all the previous brand activity and makes a lot of brandformance media (i.e. platforms that combine both branding- and performance-oriented objectives) like influencers seem less effective. One way to remedy this might be by adding a bonus for any influencer touchpoints: this way you track not just direct but also indirect installs.
Another way to get a more complete customer journey picture might be by implementing a linear attribution model with branding bonuses. This framework gives equal credit to all touchpoints in the customer journey but also adds bonuses for any influencer or branding touchpoints. For example, if a customer saw a branding ad on TikTok, clicked on an influencer’s link, and then made a purchase after seeing an Instagram ad, the model would give equal credit to each touchpoint and bonuses to the Instagram ad and the influencer touchpoint.
However, all these and many other models run into one key obstacle: accurate tracking. With more and more users opting out of tracking on mobile devices and the web, and social media platforms reinventing their ad models every business quarter, a lot of leads and customers may get lost in the ether. This is why at Zorka.Agency we offer models that take into consideration only the 100% controllable data, like the number of installs and CPI.
Such frameworks are ever-important with the growing popularity of brandformance, an approach that renders awareness activities more analyzable and performance-like in their ROI. Seeing more requests for accurate tracking and attribution, we felt like it’s worth sharing one of our influencer marketing attribution models. While it’s just a regular framework that involves some data crunching, we still believe in (and have experienced) its efficacy.
Measuring organic installs growth: Brand boost
A disclaimer before we dig deeper into this attribution model: no framework is all-encompassing or complete. Customer journeys may be sporadic, and with IDFA and similar ad identifiers being severely limited, tracking a user from point Ad to point App is more difficult than ever before. What we propose is a model that at least considers the usually ignored organic boost from the non-performance campaigns and at most provides you with a more authentic CPI that takes this organic boost into account.
With this out of the way, let’s dive in. First, we’ll need the average organic installs (AOI) of your app, net of all marketing campaigns. For some brands with an always-on social presence, this may be difficult to calculate: if anything, the whole point of the brandformance approach is that it positively influences the number of organic installs in the long run. However, a good way to approach this might be to find a relatively promo-free window in your marketing calendar and get an average install count over 20 to 30 days.
Turn installs into active and engaged customers
Grow in-app revenue and build user loyalty with custom retargeting and churn prediction campaigns from Adikteev.
Get startedThen, we’ll need the CPI of current campaigns. We suggest taking an average cost per install or per action from several UA campaigns to balance out any outliers. For those who want to get extra specific, separate CPIs according to the medium: for example, different metrics for Instagram, YouTube, and banner ads. This way you can track the organic boost within one app or social media.
These numbers represent the current static, against which our brandformance activities will be measured. When you launch the next campaign (and tracking it well goes without saying), separate the direct and indirect organic installs resulting from it. Try separating it into three groups: immediate (up to 6-8 hours after the publication, depending on the media and the bloggers’ viewing statistics), short-term (up to 7 days after the publication), and long-term (up to 28 days after the influencer publication).
Now let’s do some math. First, take the difference between the total organic installs (TOI) over a certain period and the average organic installs (AOI): this will give us the relevant organic boost. Then, divide this number by the number of direct installs (DI), and you will get the brandformance ratio. For example, with 220 additional organic and 840 direct installs, the indirect power of brand and influencer accounts for a considerable 26% boost.
Organic boost formula
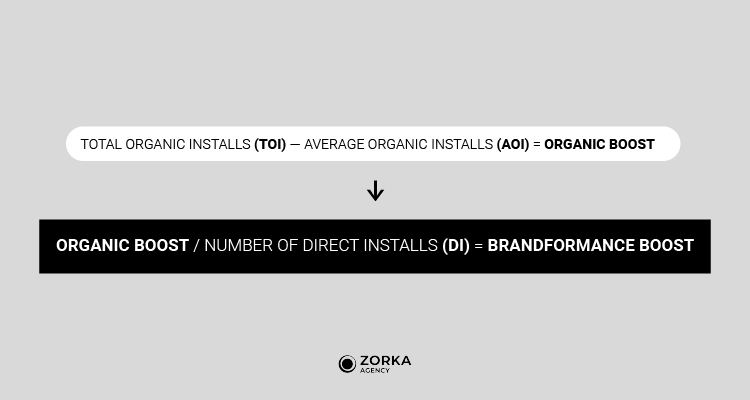
Source: Zorka.Agency
An even better way to track the so-called brand residue is to use this model for every channel and media: YouTube, TikTok, banners, and in-game ads. This way you will get more specific and relevant results and will be able to act accordingly. For example, you might want to launch a small UA campaign on TikTok at the same time you have several bloggers hyping up your app organically.
Of course, these numbers and ratios are somewhat suggestive: the real brandformance power lies in lowering (or at least keeping stable) the CPIs over different media, as well as in the marginal growth of organic installs over time. For this, we suggest tracking AOI and CPI over a longer period of time (say, 2-3 months) and measuring whether there are any improvements. Any growth of organic installs will be a sure win, and a fall in CPI (or at least a less rapid growth, compared to the industry average of 12% Y/Y) should be considered the indirect result of your brand activities. Measure these numbers long-term and compare them quarter-to-quarter to track the results of brand awareness campaigns.
Measuring cost-efficiency: Influencer media value
IMV stands for Influencer media value and claims to measure the added value of influencers’ reach. It does so in dollars: that is, how much a brand would have to spend on classical media tools like paid ads to achieve similar results. For example, a post with an IMV of $500 is equivalent to an ad campaign that has been seen by 50,000 people with a CPM of $10 and a frequency of 1. Needless to say, an IM campaign with an IMV higher than its cost should be considered a success.
And while some bloggers actually use an average CPM in their pricing strategies, it’s sometimes even more cost-efficient to work with influencers, especially with the extra niche ones (high-quality audience, more willing to work on a per-click basis) or super popular ones (eCPM is way lower than direct ads).
Even more important (and one of the key reasons the IM continues to grow year to year) is the quality of the audience. Basic ads require a frequency of at least 2–3 for them to be at least recognized later, whereas a blogger’s integration, especially an authentic and creative one, is received, recognized, and remembered better. That’s why the model we use at Zorka.Agency uses frequency alternative as an extra factor, meant to account for audience engagement.
IMV formula
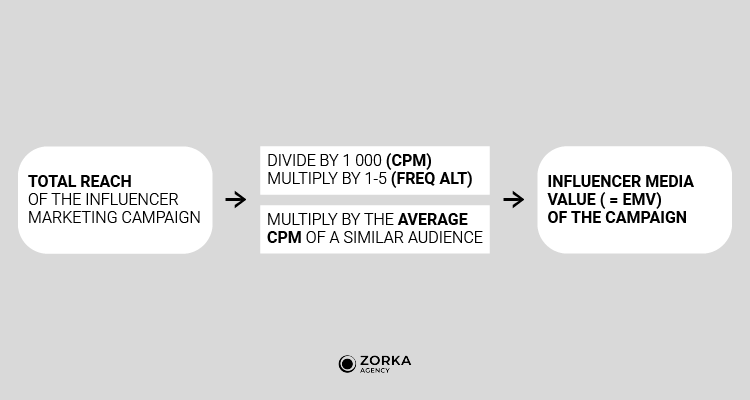
Source: Zorka.Agency
Our IMV model suggests using a scale from 1 to 5, with 1 being the least active audience (few reactions and comments, lower view depth) and 5 being the most active. Try paying attention not just to the number of likes and comments, but also to the specific mentions of the integration, as well as its tone, positive or negative. Internal video statistics from the bloggers (ERR, view depth, etc.) can also be helpful.
These two frameworks, while often updated and always adjusted to the client, provide a fairly universal way to get the two most important performance metrics from brand activities: how much of the marketing budget dollars the IM campaign allowed to save and how efficient a blogger was in triggering an organic growth in installs. Using them in your daily practice should render the effect of brand activities more visible to the team and the management.