In our Food Delivery report, we offer the most extensive research available on the industry. Find out the market size of the online food delivery industry, revenue breakdowns by app, detailed market share by region and country, usage and download statistics, and benchmarking data.
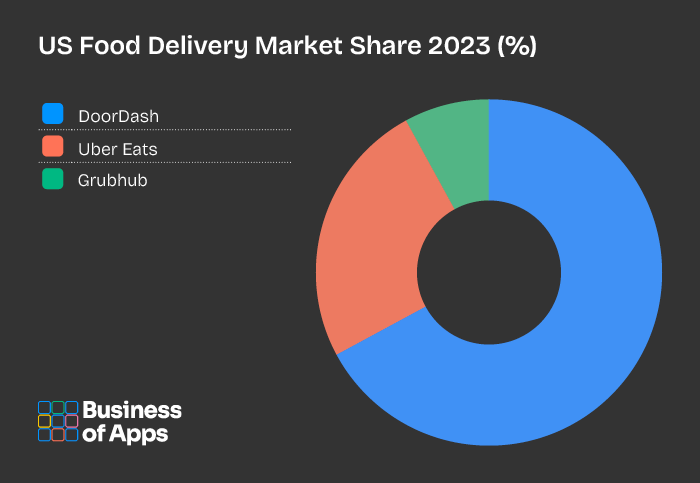
What US food delivery app has the most market share?
DoorDash has the most market share by some distance in the United States, with Uber Eats in second and Grubhub third. DoorDash rapidly ascended to the first spot, while Grubhub has declined over the past half a decade.
What is the market size of the food delivery app industry?
In 2023, the market size of the food delivery app sector increased by 16.8% to over $90 billion. Meituan, Uber Eats and DoorDash are the largest food delivery operators and the US and China are the two largest markets.
Are food delivery apps still unprofitable?
Most food delivery apps have reached some form of profitability over the past two years. Meituan, Uber Eats and Delivery Hero are profitable, while Swiggy, DoorDash and Just Eat Takeaway remain unprofitable.

Sector overview
The food delivery industry was turbocharged by the proliferation of smartphones, making it easier for customers to order food with endlessly scrolling menus and providing real-time tracking of the order. For delivery drivers, the phone provided them with the optimal route to the customer and a way to quickly verify orders at a restaurant.
This evolution of food delivery happened in the mid-2010s, with DoorDash and Uber Eats in the US and Deliveroo in the UK supplanting the old guard – Grubhub, Just Eat and Takeaway.com – in popularity and revenue. They did this by controlling the delivery service, whereas the previous generation of apps were marketplaces only.
We have seen a transition to a high percentage of delivery being performed by the app, rather than the restaurant. Instacart, Amazon, Uber and others also provide grocery delivery, which arrives within a few hours of ordering, far quicker than most supermarkets were offering before.
The past few years, there have been moves to consolidate the industry even further, alongside growing demands from investors for these apps to reach profitability. Some of them have succeeded in this, others are still yet to reach profitability.
Table of contents
- Food Delivery App Financials
- Market Size
- Market Size Forecast
- Individual App Revenues
- Revenues by Region
- Valuations
- Funding
- Individual App GMV
- Individual App Net Income
- Individual App Orders
- Food Delivery Market Share
- US Market Share
- Europe Market Share
- UK Market Share
- China Market Share
- India Market Share
- Southeast Asia Market Share
- Latin America Market Share
- Food Delivery App Usage
- Total Users
- Users by App Type
- Chinese App Users
- Individual App Users
- Individual App Subscribers
- Users by Country
- Number of Restaurants
- Food Delivery App Downloads
- Total Downloads
- Individual App Downloads
- Food Delivery App Benchmarks
- Marketing Metrics
- Revenue Metrics
- Advertising Metrics
- Service Charges
The Food Delivery App Report – Research, Insights and Statistics is provided as downloadable PDF document with all data presented as charts and tables. So you can easily extract graphics and individual data. It provides an overview of the company’s financials, as well as data on demographics and user breakdowns.

What’s included?
- Document: PDF
- Charts: 128
- Data Points: 1028
- Pages: 140
Don’t waste time searching the internet for food delivery app data – get all the main analysis in this report in one package, sourced and analyzed from multiple validated sources.
List of Charts
- Food Delivery Global Revenues
- Food Delivery Revenues by App
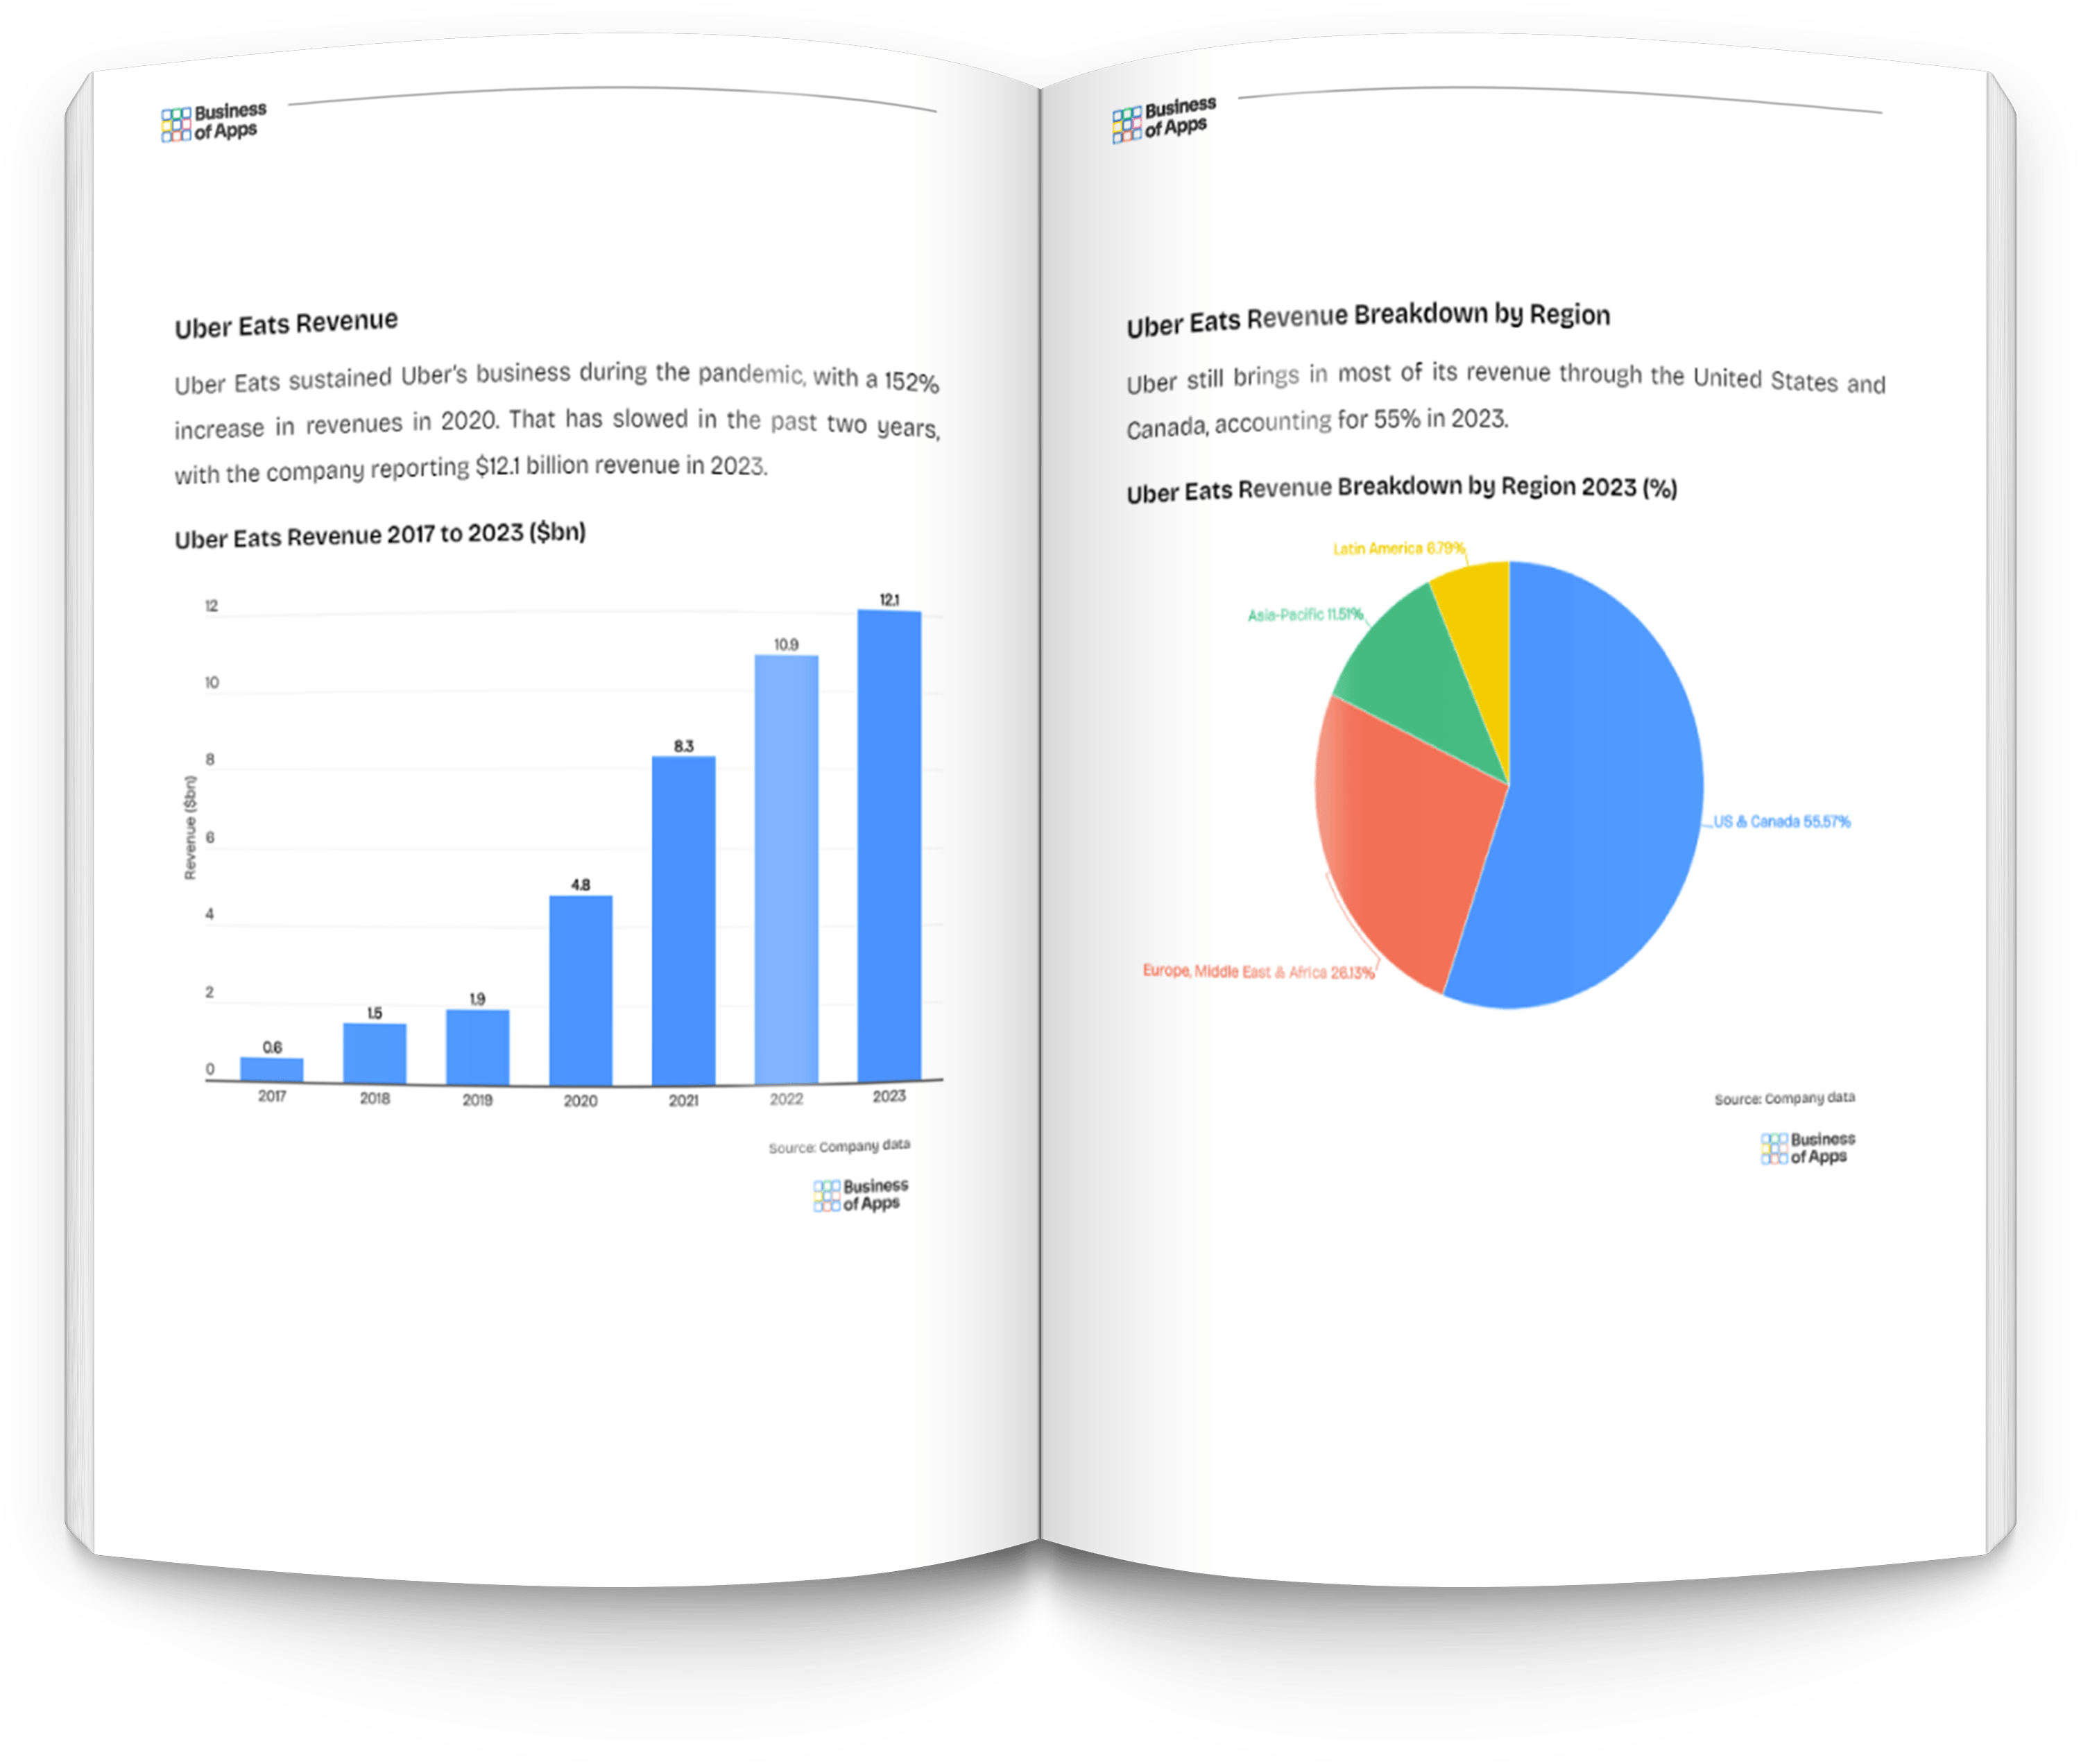
- Uber Eats Revenue
- Uber Eats Revenue by Region
- Just Eat Takeaway Revenue
- Just Eat Takeaway Revenue by Region
- DoorDash Revenue
- Deliveroo Revenue
- Deliveroo Revenue by Region
- Meituan Revenue
- Delivery Hero Revenue
- Delivery Hero Revenue by Region
- Zomato Revenue
- Swiggy Revenue
- iFood Revenue
- Rappi Revenue
- Grab Revenue
- Grocery Delivery Global Revenues
- Grocery Delivery Revenues by App
- Instacart Revenue
- Pinduoduo Revenue
- Dingdong Revenue
- Missfresh Revenue
- Getir Revenue
- Glovo Revenue
- GoPuff Revenue
- Food Delivery Revenues by Country
- Food Delivery Projected Market Value
- Food Delivery Valuations
- Food Delivery Annual Funding
- United States Revenue
- United Kingdom Revenue
- Europe Revenue
- China Revenue
- South-east Asia Revenue
- India Revenue
- South America Revenue
- Food Delivery Profits
- Uber Eats Profit
- Just Eat Takeaway Profit
- DoorDash Profit
- Deliveroo Profit
- Delivery Hero Profit
- Zomato Profit
- Instacart Profit
- Pinduoduo Profit
- Dingdong Profit
- Missfresh Profit
- Food Delivery Gross Transaction Value (GMV)
- Uber Eats GMV
- Just Eat Takeaway GMV
- DoorDash GMV
- Deliveroo GMV
- Meituan GMV
- Delivery Hero GMV
- Zomato GMV
- iFood GMV
- Food Delivery Annual Orders
- Uber Eats Annual Orders
- Just Eat Takeaway Annual Orders
- Delivery Hero Annual Orders
- Deliveroo Annual Orders
- iFood Annual Orders
- Zomato Annual Orders
- US Food Delivery Market Share
- Europe Food Delivery Market Share
- China Food Delivery Market Share
- UK Food Delivery Market Share
- India Food Delivery Market Share
- South-east Asia Food Delivery Market Share
- South America Food Delivery Market Share
- Food Delivery Global Users
- Food Delivery Platform-to-Consumer Users
- Food Delivery Restaurant-to-Consumer Users
- Food Delivery Users by App
- Uber Eats Users
- Just Eat Takeaway Users
- Delivery Hero Users
- DoorDash Users
- Deliveroo Users
- Meituan Users
- Ele.me Users
- Zomato Users
- Swiggy Users
- Instacart Users
- Grab Users
- Rappi Users
- Food Delivery Users by Country
- Number of Restaurants by App
- Food Delivery Global App Downloads
- Uber Eats Downloads
- Just Eat Downloads
- Delivery Hero Downloads
- DoorDash Downloads
- Deliveroo Downloads
- iFood Downloads
- Getir Downloads
- Instacart Downloads
- GoPuff Downloads
- Food Delivery Retention Rate
- Food Delivery Install Rate
- Food Delivery Action Rate
- Food Delivery Churn Rate
- Food Delivery Conversion Rate
- Food Delivery Usage Rate
- Food Delivery Average Sales Per Merchant
- Food Delivery Advertising Spend
- Food Delivery Service Fees
How does it work?
To get access to the Food Delivery App Report – Research, Insights and Statistics hit the buy now button above. After payment you will be taken to the download page to access your Food Delivery App Report – Research, Insights and Statistics PDF. If you need any help email data@businessofapps.com.
We have joined Treeapp, an incredible organization dedicated to reforesting the world. They will plant one tree for your data report purchase.
What our customers say about our reports

“Your report gave us some very useful insights on app statistics. As we are starting to develop apps it’s crucial information”

“This report is great work, it helped us get a better understanding of revenue and growth to include it in our analysis for LatAm. It has been very useful.”

“We have found Business of Apps data to be most accurate and complete on the web.”

“All the metrics and KPIs I was looking for are in one document for a very good price. The report was exactly what I expected.”

"There was an abundance of excellent information in the report, well worth the money. There were areas which had information I haven't seen anywhere else."

"Money well spent as far as I am concerned. A clear, well-written report"

“What a great resource!”

"This data has been a huge help for us launching our dating app"