Our Dating App Report is the most thorough research available on the internet, with over 100 pages of data on the dating app industry. It includes market size projections, individual app revenues, usage and download statistics, country-specific market share, demographics by app and benchmarking statistics.
Which dating app makes the most revenue?
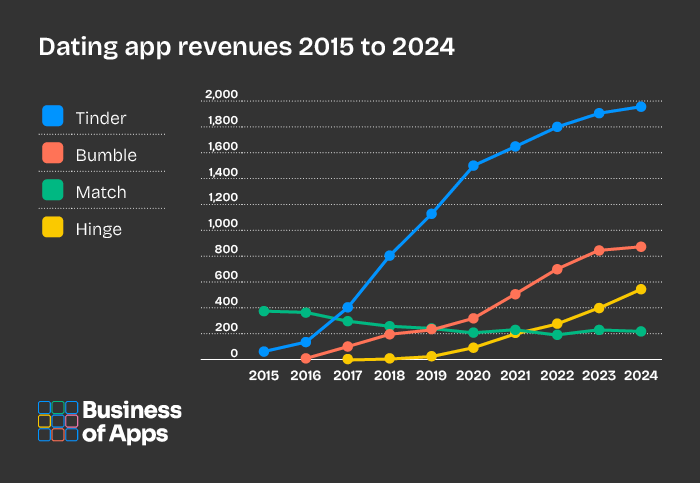
Tinder generates the most revenue and made two times more revenue than its closest competitor, Bumble, in 2024. Tinder has been the lead app since 2017, when it surpassed Match in total revenue.
What is the market size of the dating app industry?
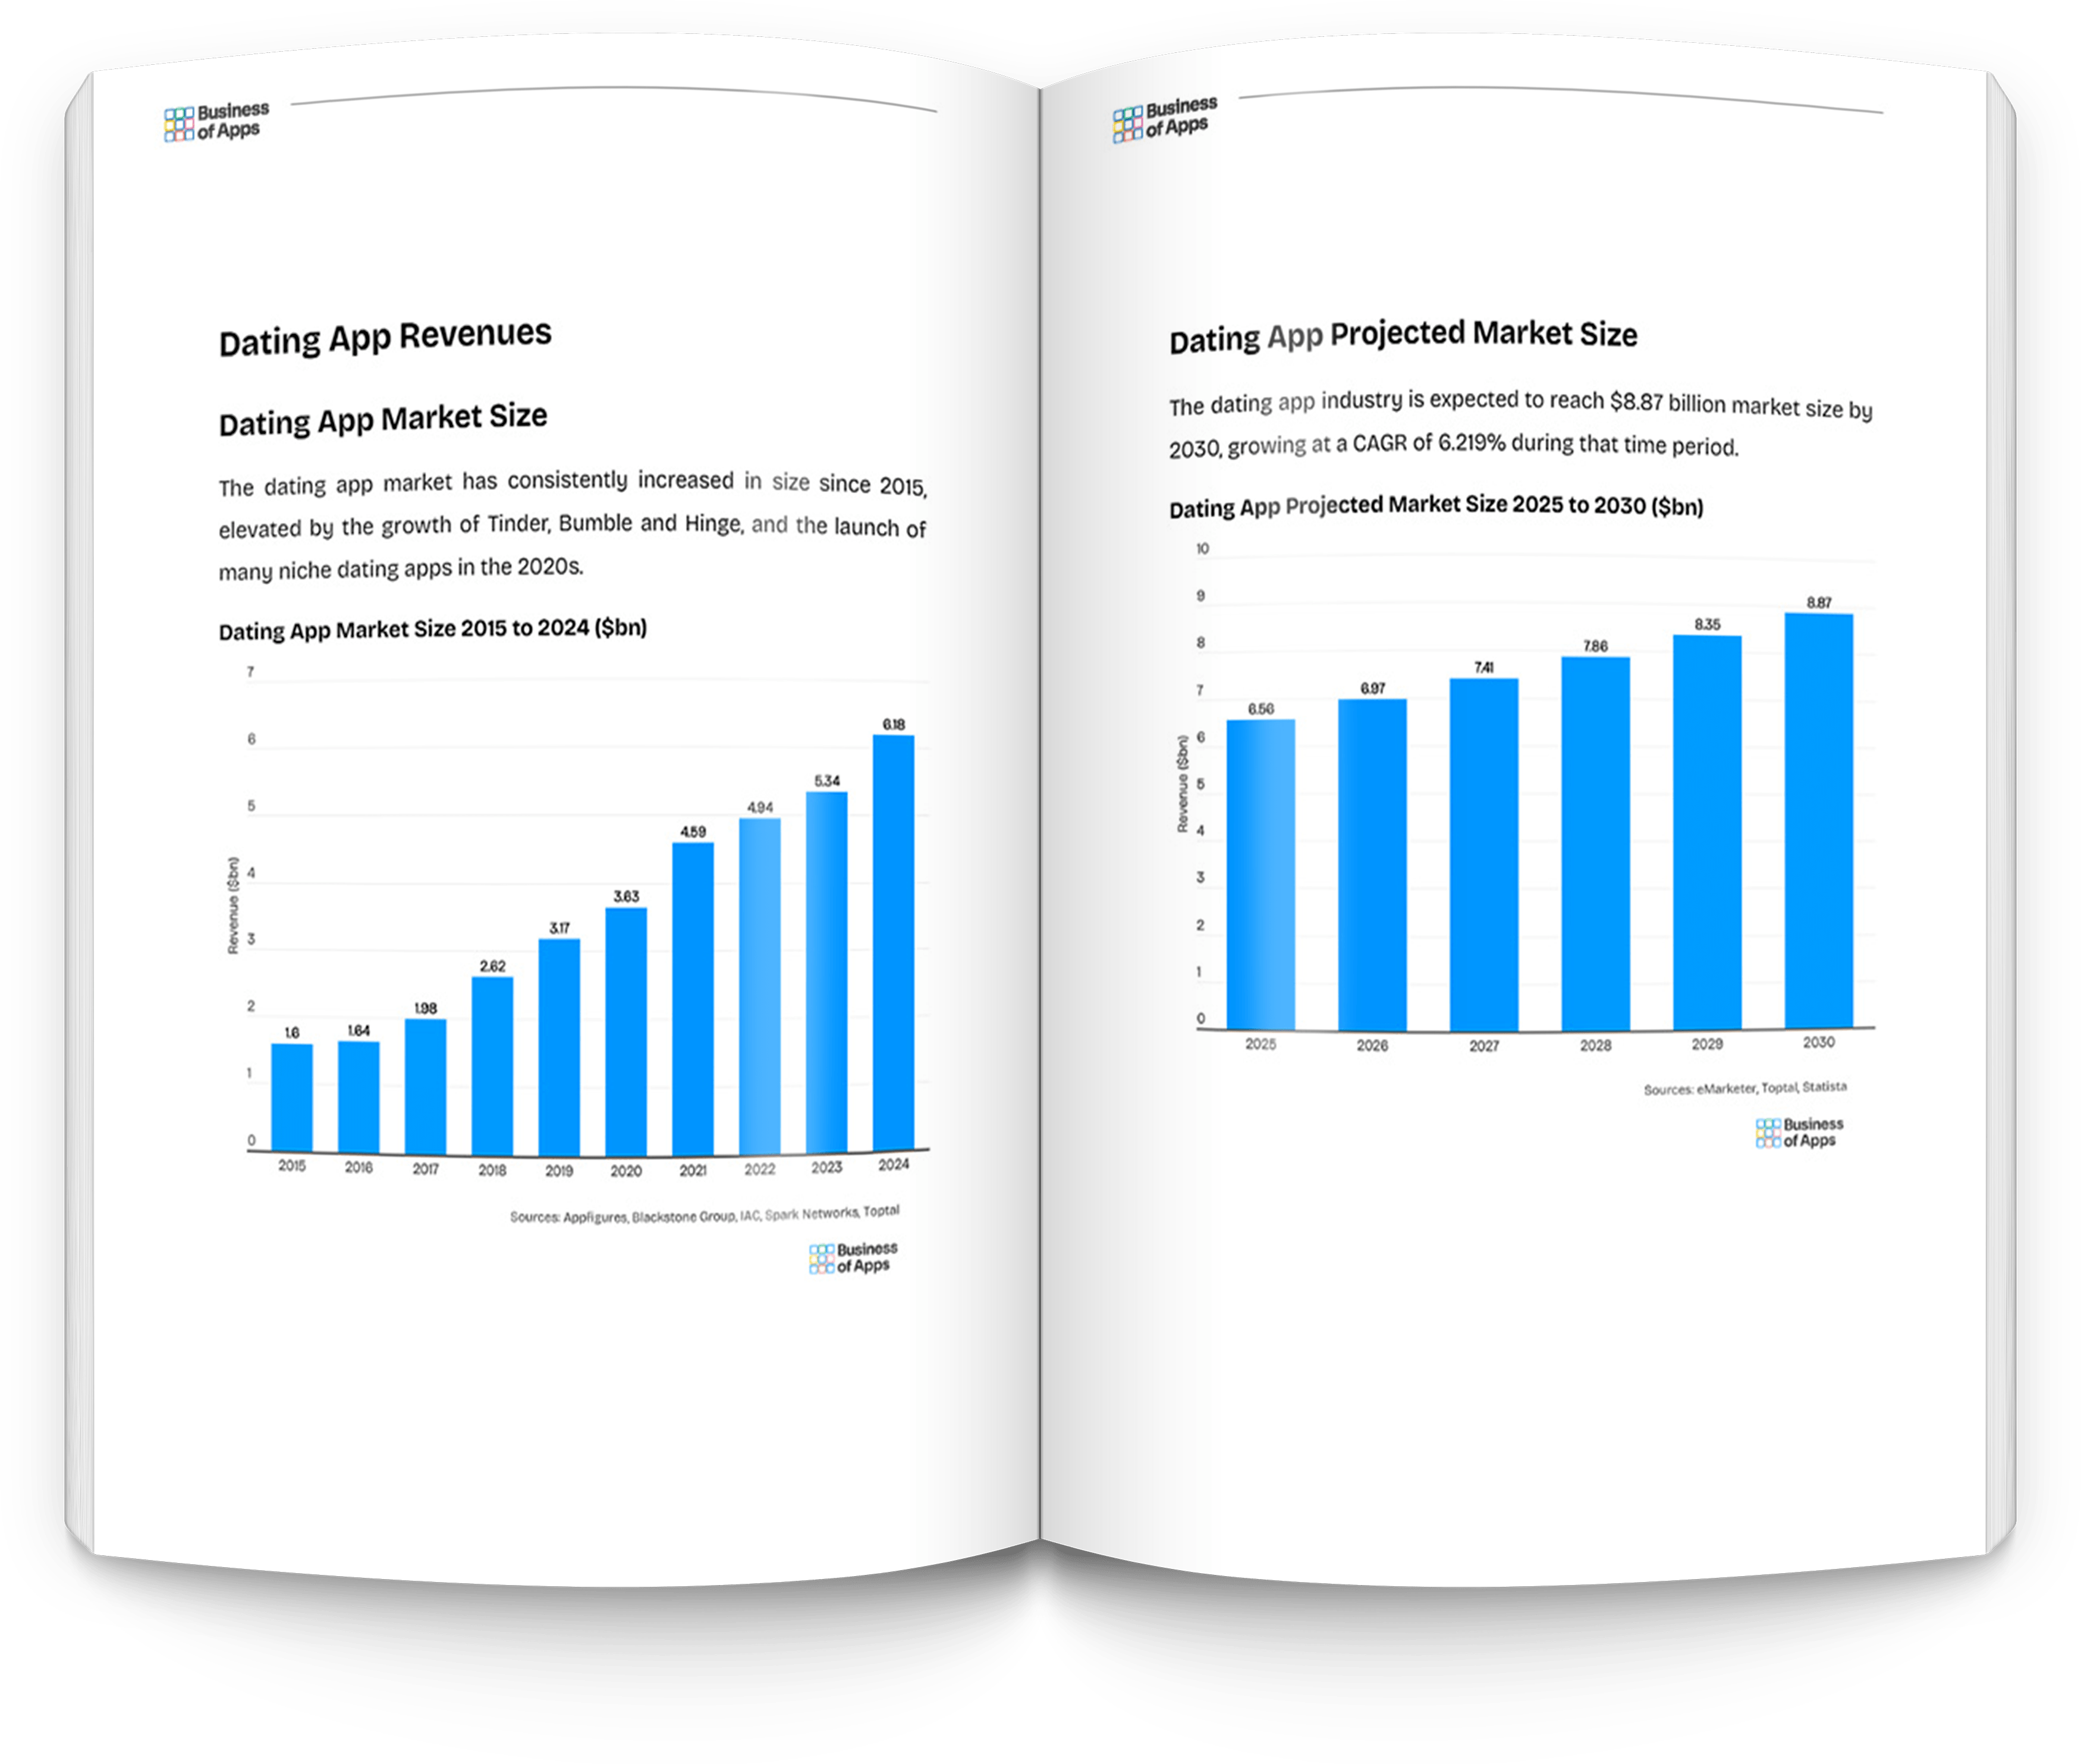
The dating app industry had a market size of over $6 billion in 2024, an 15.7% increase on the previous year. iOS is responsible for approximately 80% of mobile revenue in the dating app industry.
How many people use dating apps?
Approximately 360 million people used dating apps globally in 2024, an increase of about 15 million on the year prior. Tinder has about 90 million users on its platform, more than any other.

Sector overview
Online dating was transformed with the introduction of Tinder in 2012 and the swipe left to like or swipe right to dislike functionality, which has been embedded into almost every other dating app subsequently due to its popularity and ease-of-use.
Before Tinder, online dating was a more formal affair with users being matched simply based on location and preferences. Users would typically receive a few potential matches in one batch and be able to talk and set up meetings with them through the dating app interface.
Tinder was a jolt of energy to a rather lethargic industry, which was still struggling to make online dating mainstream. It did this through appealing to younger age demographics, which, as mobile phones became more commonplace, switched real-life interactions and meetings for the screen.
Tinder remains the lead app in the market, but it has faced some new challenges. Bumble challenged it through a new system of allowing women to message first, while Hinge’s prompts offered new ways for potential dates to interact and find out if they’re compatible before meeting.
Table of contents
- Dating App Revenue
- Market Size
- Market Size Forecast
- Individual App Revenues
- Revenues by Platform
- Average Revenue per User
- Acquisitions
- Dating App Usage
- Total Users
- Individual App Users
- Users by Country
- Individual App Subscribers
- Web Visits
- Dating App Downloads
- Total Downloads
- Individual App Downloads
- Downloads by Country
- Dating App Market Share
- Market Share US
- Market Share UK
- Market Share India
- Market Share Brazil
- Market Share Germany
- Market Share France
- Market Share Nordics
- Dating App Demographics
- Age Demographics
- Individual App Age Demographics
- Individual App Gender Demographics
- Dating App Benchmarks
- Marketing Metrics
- Subscription Costs
- User Acquisition Metrics
- Engagement Metrics
- Advertising Spend
The Dating App Report – Research, Insights and Statistics is provided as downloadable PDF document with all data presented as charts and tables. So you can easily extract graphics and individual data. It provides an overview of the sector’s financials, usage, downloads, market share, demographics, and benchmarks.

What’s included?
- Document: PDF
- Charts: 125
- Data Points: 1954
- Pages: 131
The Dating App Report – Research, Insights and Statistics has been assembled by our in-house team of analysts at Business of Apps. We believe this is the most comprehensive report available on the app market. If you have any questions get in touch data@businessofapps.com
What apps are covered in this report?
- Tinder
- Bumble
- Hinge
- Plenty of Fish
- Match
- OKCupid
- Badoo
- Grindr
- Tantan
- Zoosk
- Happn
- eHarmony
- Raya
- Hily
- Pure
- Feeld
- The League
- Omi
- SweetMeet
List of Charts
- Dating App Market Size
- Dating App Projected Market Size
- Dating App Market Size by Region
- Tinder Revenue
- Bumble Revenue
- Plenty of Fish Revenue
- Match Revenue
- Badoo Revenue
- OK Cupid Revenue
- Grindr Revenue
- Hinge Revenue
- Tantan Revenue
- Zoosk Revenue
- Happn Revenue
- Raya Revenue
- Hily Revenue
- Pure Revenue
- Feeld Revenue
- Dating App Revenues
- Dating App iOS Revenues
- Dating App Android Revenues
- Dating App Average Revenue Per User
- Dating App Worldwide “Lifetime Average Revenue Per Download”
- Dating App Acquisitions
- Dating App Users
- Dating App Projected Users
- Tinder Users
- Bumble Users
- Badoo Users
- Hinge Users
- Grindr Users
- Plenty of Fish Users
- Match Users
- Happn Users
- Tantan Users
- SweetMeet Users
- Omi Users
- Hily Users
- Pure Users
- Feeld Users
- Zoosk Users
- eHarmony Users
- Dating App Users in the United States
- Tinder Paying Users
- Bumble Paying Users
- Badoo Paying Users
- Hinge Paying Users
- Raya Paying Users
- Match Group Other Paying Users
- Dating App Monthly Web Visits
- Dating App Downloads
- Tinder App Downloads
- Bumble App Downloads
- Badoo App Downloads
- Hinge App Downloads
- Grindr App Downloads
- Plenty of Fish App Downloads
- Happn App Downloads
- Tantan App Downloads
- OKCupid App Downloads
- Match App Downloads
- Zoosk App Downloads
- eHarmony App Downloads
- SweetMeet App Downloads
- Omi App Downloads
- Raya App Downloads
- Hily App Downloads
- Pure App Downloads
- Feeld App Downloads
- Dating App Downloads in the United States
- Dating App Downloads in the United Kingdom
- Dating App Market Share in US
- Dating App Market Share in UK
- Dating App Market Share in India
- Dating App Market Share in Brazil
- Dating App Market Share in Germany
- Dating App Market Share in France
- Dating App Market Share in Nordics
- Dating App Revenue by Country
- Dating App Downloads by Country
- Dating App Age Demographics
- Tinder Age Demographics
- Bumble Age Demographics
- Hinge Age Demographics
- Badoo Age Demographics
- Plenty of Fish Age Demographics
- Other Dating App Age Demographics
- Tinder Gender Demographics
- Bumble Gender Demographics
- Hinge Gender Demographics
- Badoo Gender Demographics
- Match Gender Demographics
- Other Dating App Gender Demographics
- Dating App Subscription Benchmarks
- Dating App Retention Rate
- Dating App Retention Rate by Platform
- Dating App Subscription Retention Rate
- Dating App Activation Rate
- Dating App Conversion Rate
- Dating App Renewal Rate
- Dating App Subscription Duration Rate
- Dating App Trial Duration Rate
- Dating App Subscription Costs
- Dating App General Cost Per Action
- Dating App iOS Cost Per Action
- Dating App Android Cost Per Action
- Dating App APAC Cost Per Action
- Dating App EMEA Cost Per Action
- Dating App NA Cost Per Action
- Dating App Average Use Per Day
- Dating App Average Time Open Per Day
- Reasons Why People Use Dating Apps
- Profile Features Users Want
- Frustrations with Dating Apps
- Reasons for User Churn
- Match Group Advertising Spend
- Bumble Advertising Spend
- Spark Networks Advertising Spend
How does it work?
To get access to the Dating App Report – Research, Insights and Statistics hit the buy now button above. After payment you will be taken to the download page to access your Dating App Report – Research, Insights and Statistics PDF. If you need any help email data@businessofapps.com.
We have joined Treeapp, an incredible organization dedicated to reforesting the world. They will plant one tree for your data report purchase.
What our customers say about our reports

“Your report gave us some very useful insights on app statistics. As we are starting to develop apps it’s crucial information”

“This report is great work, it helped us get a better understanding of revenue and growth to include it in our analysis for LatAm. It has been very useful.”

“We have found Business of Apps data to be most accurate and complete on the web.”

“All the metrics and KPIs I was looking for are in one document for a very good price. The report was exactly what I expected.”

"There was an abundance of excellent information in the report, well worth the money. There were areas which had information I haven't seen anywhere else."

"Money well spent as far as I am concerned. A clear, well-written report"

“What a great resource!”

"This data has been a huge help for us launching our dating app"
