![]()
App marketing results and performance can be difficult to assess on their own, but it’s also difficult to know exactly where your app stands compared to the competition.
For example, while some churn is natural, knowing if your churn rates are particularly high compared to standard user behavior can help you determine if there are changes that need to be made in order to avoid losing out on interested users and revenue.
This article originally appeared on the MyTracker blog.
Knowing benchmarks for your specific game genre is a good start to make sure that your app is living up to its full potential, and we want to help with that.
Here at MyTracker, we’re all about being able to make informed decisions, so we pulled data to look at paying users and rolling retention rates for different niches across the games industry.
Where our data comes from
MyTracker is an app data analytics tool, and for this study, we’ve compiled information from more than 120 million app installs worldwide, on both iOS and Android.
All of this data was pulled from our tool, and it is recent, as it was sourced from 1st June 2021 to 31st December 2021. This was post-iOS 14.5 changes when the effects on metrics and tracking had been well established.
We sourced the app genres from AppAnnie.
What our study examined
- We wanted to assess the leading gaming app genres in terms of both rolling retention and paying user rates in the time immediately after installs, and to assess standard benchmarks for each.
- We also wanted to see whether, in the week following installation, paying usage and rolling retention increased or decreased in the apps for each genre.
These metrics are important because they help developers get a good idea of how many users are sticking around post-install, and how many convert (and when).
The paying user (PU) rate is calculated by dividing the number of unique paid users on day N by the total number of users who installed the app N days ago multiplied by 100.

Download our MMP Buyers Guide
Having a trusted partner for accurate, unbiased, indisputable data and real-time insights is no longer a nice-to-have, it’s a must-have. Download our guide to help choose your next MMP provider.
DOWNLOADThe rolling retention (RR) rate is calculated by dividing the number of users who engaged with the app on day N (or later) by the number of users who installed the app N days ago multiplied by 100.
Our findings
As we’ve discussed, we looked at rolling retention (RR) and paying user (PU) rates.
Here’s a quick breakdown of what we found:
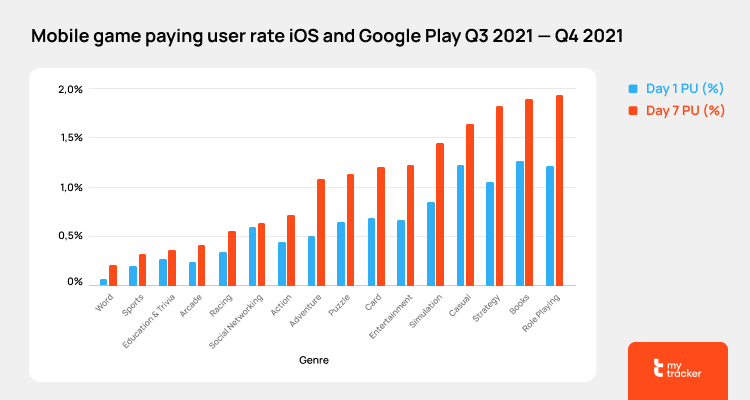
The highest and lowest PU rates
The lowest paying user rate on Day 1 is among Word games, with a Day 1 PU of 0.08%
The highest PU rates on Day 1 were for the following categories:
-
- Casual – 1.23%
- Role Playing (RPG) – 1.24%
- Books – 1.28%
The Day 7 PU data showed that the highest- and lowest-performing genres were consistent, with one exception: Strategy games (1.83%) outperformed Casual games (1.64%).
The Words category had the highest increase in Day 7 PU compared to Day 1 (reaching 173%).
You can see the full breakdown here:
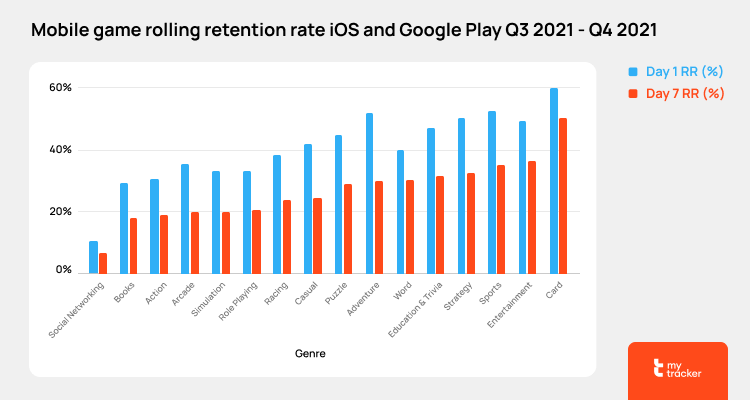
The highest and lowest RR rates
Card games had the highest Day 7 RR rate at 50%, and Social Networking games had the lowest (6.51%).
Arcades showed the most drastic drop of all in RR, amounting to 43% (Day 7 vs Day 1).
Average PU and RR rates across all niches
- The average Day 1 PU rate across all niches was 0.67%.
- The average Day 7 PU rate across all niches was 1.10%.
- The average Day 1 RR across all niches was 36.67%.
- The average Day 7 RR across all niches was 22.55%.
Why we believe performance varies
As you can see above, there are some significant variations in both the rolling retention rate and the rate of paying users across gaming categories. Let’s take a look at why we believe this is the case.
Social networking games
Data at a Glance: Has the lowest rolling retention rate on Day 1 among all categories at 11%, which dropped by half on Day 7. Day 1 PU is 0.6% and has barely shifted on Day 7.

Social networking games are typically going to be “party”-styled games. Because there’s a social element, payments typically happen on the first day when everyone downloads the app and pays for access.
Because these games often rely on continual group engagement, this explains the lower retention rates and lower payment rates after the first day. As you can see from our data above, PU has barely shifted on Day 7 compared to Day 1.
The good news: These games can have a viral effect, so you may be able to generate a lot of sales quickly.
Book games (interactive stories)
Data at a Glance: One of the lowest retention rates across all genres after Social Networking games and the highest in terms of Day 1 PU.

Book game apps are most popular amongst female users, and retention may be low because they either suck you in right away or you leave. The game needs to connect with the right audience in order to see conversion to payment spiking.
Users who are engaged, however, can be more loyal as they become invested. This is why we see the PU rate increase on Day 7 by 49% despite retention rates falling by 40% by that point.
Action games
Data at a Glance: One of the lowest Day 1 RR among all game genres.

There’s a ton of competition in the action games sphere, as it’s a popular genre. This was the genre that had the largest number of installs in our study.
Arcade games
Data at a Glance: Retention drops by 43% on Day 7 compared to Day 1, giving us the most dramatic drop across all genres. Also one of the lowest Day 1 PU among all genres.

These games are based on fast-paced reactions or skill, and thus can be tricky. Therefore, you need to create that perfect gameplay where the game is neither too complicated nor too easy to play.
They typically have lower conversion rates from the beginning as a result of users getting too frustrated with the challenge (or lack thereof), and their long-term retention rates are difficult to maintain.
Simulation games
Data at a Glance: Ranked 13 out of 16 in terms of RR on Day 1, but ranked 5 out of 16 in terms of Day 1 PU.

You’ll notice that simulation games have very similar performance to role-playing games (see below). They borrow RPG mechanics, and vice versa, to create an engaging and dynamic play opportunity for users.
Role-Playing games
Data at a Glance: Ranked 12th in terms of RR Day 1, and one of the highest in terms of Day 1 PU after Books. Day 7 PU is the highest of all.

Role-playing games (“RPGs”) are among the Top 3 most profitable game genres, with a revenue share of 14%. It was also the second-largest category in the app sample that we pulled the data from.
Compared to other game genres, RPGs have one of the highest percentages of whales, who typically generate 86.6% of the total revenue. The same research proves that it takes whales longer to make their first purchase: they typically like to take their time before committing to spending. Our data backs this up, as RPGs’ PU on Day 7 is the highest of all genres.
Education & Trivia games
Data at a Glance: Ranked 7th in terms of Day 1 RR, and ranked 13th (out of 16) for Day 1 PU.

This category includes quizzes and trivia apps. According to Statista’s annual report, the Trivia genre is among the least profitable ($247m compared to $88,900m in role playing games and $20,841m in simulation games. This aligns with our own data.
Racing games
Data at a Glance: Ranked 10th in terms of Day 1 RR, and 12 out of 16 in terms of Day 1 PU, putting this category towards the lower end for performance.

Racing games can be thrilling, with about a quarter of all mobile gamers naming racing games as their favorite niche. That being said, this niche has a much lower-than-average paying user rate than many other niches, which may be partially because many consumers are much more likely to play these games on console than mobile.
Casual games
Data at a Glance: Ranked 8th out of 16 in terms of Day 1 RR, and ranked 3rd out of 16 in terms of Day 1 PU. One of the most significant drops in terms of Day 7 RR compared to Day 1, with a 42% decrease.

The Casual gaming niche, for example, virtual farm games, gives people a laid-back gameplay option.
It’s no surprise that games in this category can have high PU and RR rates. As users become engaged with the app, they also want a gaming experience that’s convenient. They don’t want to wait an hour for a carrot to grow on their farm, so they’re willing to buy a booster to accelerate the process.
Puzzle games
Data at a Glance: Ranked 7th out of 16 in terms of Day 1 RR and 8th out of 16 in terms of Day 1 PU. Has a solid PU increase rate from Day 1 to Day 7, showing consistent performance.

Puzzle games are fast and affordable to develop thanks to essential frameworks and templates that developers can use. The variety of such games is massive, giving you plenty of room to work with, and they yield average performance across the board.
These games can also have exciting plots, interesting gameplay, and high virality. No wonder The Guinness Book of World Records named Bejeweled the most popular puzzle game of the century (it was later beaten by Candy Crush).
Users love puzzles, and some may be happy to pay for access to additional puzzles, extra lives, hints, or new levels up.
Adventure games
Data at a Glance: One of the highest Day 1 RR, but a huge (42%) drop in RR by Day 7 (Casual and Adventure games have the highest drops in terms of RR).
This one’s a rollercoaster, though, with a huge drop in RR and a dramatic increase in PU at the same time, skyrocketing to 110%. It’s an inverse relationship that can work in an app’s favor.

This is a broad genre, but it still has high retention rates and conversion-to-payment rates.
Most games have users proceed through various adventures before running into a paywall: you either need to accomplish a specific task, you need to wait, or you pay to advance to the next level. If you can keep users engaged, that’s good news for your retention and conversion rates.
Word games
Data at a Glance: These games had the lowest PU rate both on Day 1 and Day 7 across all genres with about a 25% drop in retention from Day 1 to Day 7.

Word games are popular with users who love a mental challenge and who want to kill a little time. Conversion to payment is almost non-existent (0.08% on Day 1 and 0.22% on Day 7), but retention rates can be solid (30% on Day 7).
Strategy games
Data at a Glance: Ranked 4th out of 16 in terms of Day 1 and 7 RR, and ranked 4th out of 16 in Day 1 PU, giving it a consistent performance across both metrics.

This is a top genre for Day 7 PU, so long as you can get users engaged, proving that these users are highly motivated from the outset. Strategy games require some time investment from users in order to be able to truly play, so you’ve got users who start and are willing to give it time (and funds) for the long-term payoff. Strategy players typically spend more than 30 minutes per session.
The total revenue for the Strategy games segment is projected to be $27,833 million in 2022.
That being said, be willing to wait a few days to see those conversions, because it takes time for them to commit.
Sports games
Data at a Glance:: Ranked 2nd in terms of Day 1 RR, but ranked 15th out of 16 in terms of Day 1 and 7 PU.

The sports niche has a solid Day 7 RR at 35.38%, and it’s a popular one amongst users. People are familiar with the mechanisms of many of these games before they even start playing (if they go looking for a billiard game, they’ll look for a particular app), so there’s a little learning curve.
Entertainment games
Data at a Glance: Ranked 2nd in terms of Day 7 RR. Retention was stable compared to other categories, with only a 26% drop from Day 1 to Day 7.

The entertainment game category is made up of a large number of diverse app types. That being said, it had high growth rates in PU (with 82% growth from Day 1 to Day 7) and stable retention, going from 49.58% on Day 1 to 36.67% on Day 7.
Card games
Data at a Glance: Ranked 1st in terms of RR both Day 1 and 7. The smallest drop in Day 7 RR compared to Day 1 (players stick!), with only a 17% decrease.

Card games typically have strong retention rates, with a 50.21% Day 7 RR and a 1.21% Day 7 PU. Casino and card games also have the longest average time per session on mobile at 22 minutes, which is 5x more than other genres.
Like Sports games, this is largely because people who install apps are highly motivated to play a specific type of game. And since card games are associated with the exchange of funds in real life (think poker!) it’s normalized and feels like “part of the experience” since you may be able to spend and win real money.
Final Thoughts
App performance can vary significantly based on the game niche that you fall into, and it’s always a good idea to know what standard performance should look like.
- The highest paying user rates were Casual games, Role playing games, Books, and Strategy games, though it took Strategy games until Day 7 to see those conversions.
- Card games had the highest Day 7 rolling retention rate, and Book games had the lowest.
Rolling retention and paying user metrics both therefore play an important part in evaluating performance; some categories may have low retention but higher PU rates, while others have the reverse.
It’s essential to know where you fall so you can determine the best monetization strategy for your brand. If, for example, you have high retention rates but low conversion rates, monetization through ad networks may be a better option than relying exclusively on in-app purchases.
This ultimately comes down to knowing what offers to give individual users and when, and using tools to help with that is the way to go. MyTracker Personalize can help you boost your monetization efforts and ultimately increase profit by helping you improve the user experience with personalized offers, discounts, optimal subscriptions, and more.
Want to learn more about how best to monetize your app? See how Hustle Castle increased their ARPU by 23% using Personalize.