Mobile app analytics tools have become an essential part of the mobile app industry. These tools help companies track and analyze their app’s performance, user behavior, and marketing campaigns.
They also provide insights into how users interact with an app, helping companies to optimize their app’s performance and overall user experience. We’ve put together a carefully selected list of the top app analytics tools so you can identify the best one for your company.
Top Mobile App Analytics Tools


According to a recent report, the number of abandoned apps on app stores rose 6% from 1.76 million to 1.86 million in Q3 2022. The number of ‘super abandoned apps’, those that haven’t received an update in over 5 years, climbed to 348,000. That’s a considerable number of wasted apps.
In other words: the importance of creating a user-friendly and engaging app is more important than ever.
To build such an app, companies need to understand their users’ behavior and preferences. This is why mobile app analytics tools are critical. These tools provide companies with valuable insights into user behavior, which helps them make informed decisions about their app’s development and marketing strategies.
In this guide, we’ll detail the top mobile app analytics tools that help you track and analyze your app’s performance. We’ll cover the features and benefits, the cost, as well as how to choose the right one.

Mobile app analytics guide
Download our Mobile App Analytics guide to learn about the best app analytics tools in the space to use for your app business.
What are mobile app analytics?
Mobile pp analytics are a common concept in the mobile app world in which app marketers collect valuable data, such as the number of installs and visitors, session lengths, retention and conversion rates and other key metrics that represent user behaviour and app performance.
While the practice captures activity on the mobile web, app analytics mainly focus on data analytics for the iOS and Android platforms, where there are a range of metrics available to examine to determine what to change, where maintenance is required and what is actually working for your app.
The goal with utilizing mobile analytics platforms is to transform data into valuable information that provides insight into your product. This should allow you to better understand your user journey and spot common issues that customers may experience when using your app.
Featured Mobile App Analytics Tools
The best mobile app analytics tools
App analytics tools provide insights into how users interact with your mobile app. These tools gather data on user behavior, such as the number of downloads, active users, user engagement, retention rates, and in-app purchases.
This information can be used to optimize an app’s performance and user experience, as well as inform key marketing and business decisions.
We’ve listed the best app analytics tools below.
1. Glassbox
 Glassbox allows brands to capture, analyze, and optimize customer experiences across their mobile apps. The tool essentially records and replays user sessions to provide companies with insights into how customers interact with their digital products.
The gathered data can be used to improve website and app design, identify and fix bugs, and enhance the overall user experience.
Overview
Glassbox was founded in 2010 by Yoav Schreiber and Hanan Blumstein. The company is headquartered in London, with additional offices in New York, Tel Aviv, and Melbourne.
Since its founding, Glassbox has grown significantly and has become a leading player in the digital analytics market, serving customers in a range of industries, including financial services, retail, healthcare, and travel.
Services
Glassbox provides its customers with the following services:
- Allows brands to record and replay user sessions, giving them access to valuable insights into customer behavior
- Real-time analytics service that allows brands to monitor user behavior as it happens, providing them with insights that can be used to improve the user experience
- Heatmaps that provide a visual representation of user behavior on a website or app, allowing you to identify areas of the platform that are receiving the most engagement
2. Mixpanel
 Mixpanel is an analytics service that helps companies track user engagement with their websites and mobile apps. It provides real-time data and insights into user behavior, allowing businesses to make data-driven decisions.
Mixpanel offers a variety of features, including event tracking, user segmentation, cohort analysis, and funnel analysis. It’s widely used by startups and large companies alike in industries such as eCommerce, gaming, and social media.
Overview
Mixpanel was founded in 2009 by Suhail Doshi and Tim Trefren. Mixpanel believes that democratizing access to data and analytics can help companies of all sizes and industries thrive in the digital age.
As of 2021, the platform has more than 26,000 customers, including well-known companies such as Uber, Expedia, and Samsung.
Services
Mixpanel provides its customers with the following services:
- Helps companies group their users based on shared characteristics, such as demographics, behavior, and preferences
- Enables businesses to analyze user behavior over time by grouping users based on when they first started using a product
- Allows companies to understand how users move through a series of steps or actions, such as signing up for a service or making a purchase
3. Firebase
 Firebase allows app developers to track user behavior and measure the effectiveness of their app across different platforms, such as Android, iOS, and the web.
The platform provides insights into user engagement, retention, and in-app purchases and offers real-time reporting, user segmentation, and conversion tracking features.
Firebase Analytics can be easily integrated into any existing Firebase project and provides a comprehensive view of the app’s performance across all platforms.
Overview
Firebase was founded in 2011 by Andrew Lee and James Tamplin. Initially, Firebase was a backend-as-a-service (known as BaaS) platform that provided app developers with a way to store and sync data in real time across multiple devices.
In 2014, Firebase was acquired by Google, and since then, it has expanded its services to include a wide range of tools for mobile and web development, including Firebase Analytics.
Services
Firebase provides its customers with the following services:
- Helps developers identify and fix performance issues in their mobile and web apps
- Allows developers to manage app configurations and settings in real time without requiring a new app release
- Helps developers track, prioritize, and fix app crashes and errors
4. Amplitude Analytics
 Amplitude Analytics is an analytics platform that helps companies understand user behavior, improve engagement, and drive growth. It allows businesses to collect, manage, and analyze data from various sources to gain insights into user behavior across different channels.
Companies can track user activity, measure user engagement, and identify opportunities for optimization and growth. The platform provides a range of features, including user segmentation, funnel analysis, retention analysis, and A/B testing.
Overview
Amplitude Analytics was founded in 2012 by Spenser Skates and Curtis Liu. The company is based in San Francisco, California, and has been growing steadily ever since.
Today, thousands of companies worldwide use Amplitude to gain insights into user behavior and improve their products.
Services
Amplitude provides its customers with the following services:
- Helps businesses to understand why users are leaving and how to retain them by analyzing their user behavior
- Provides a platform for testing different variations of a product to determine which one performs better and drives more engagement
- Allows businesses to group users based on their behavior over time to gain insights into how different user segments interact with their product
5. Embrace
 Embrace is a mobile-first performance management platform that helps companies monitor, diagnose, and improve the performance of their apps.
The platform provides real-time insights into key metrics such as crashes, errors, and app load times, as well as user behavior and app flows. Embrace Analytics uses machine learning algorithms to identify issues and anomalies in app performance.
Overview
Embrace was founded in 2016 by Fredric Newberg and Eric Futoran. The company is based in San Francisco, California, and has been growing rapidly since its inception.
Embrace provides its mobile-first platform to companies in various industries, including eCommerce, gaming, and on-demand services. Clients include Square, DraftKings, and OkCupid.
Services
Embrace provides its customers with the following services:
- Allows developers to replay user sessions to understand how users interact with their app and identify opportunities for improvement
- Provides detailed app flow analysis to enable developers to understand how users navigate through their app and identify areas of friction
- Uses machine learning algorithms to identify issues and anomalies in app performance and provide actionable insights to developers
6. CleverTap
 CleverTap is a customer engagement (and retention) platform that helps businesses understand user behavior, personalize engagement, and drive growth.
The platform provides a range of features, including user segmentation, behavioral analytics, A/B testing, and personalized messaging to help businesses engage with their customers.
Overview
CleverTap was founded in 2013 by Sunil Thomas, Anand Jain, and Suresh Kondamudi. The company is headquartered in Mountain View, California, and has offices in Mumbai, Singapore, and Amsterdam.
CleverTap has become a leading customer engagement and retention platform used by thousands of businesses around the world.
Services
CleverTap provides its customers with the following services:
- Enables app businesses to segment users based on their behavior, demographics, and other criteria to gain insights into their needs, preferences, and behaviors
- Provides detailed behavioral analytics to help you understand how users interact with your app and identify opportunities for optimization
- Enables brands to test different variations of their engagement strategies to determine which one performs better
7. Apple Analytics
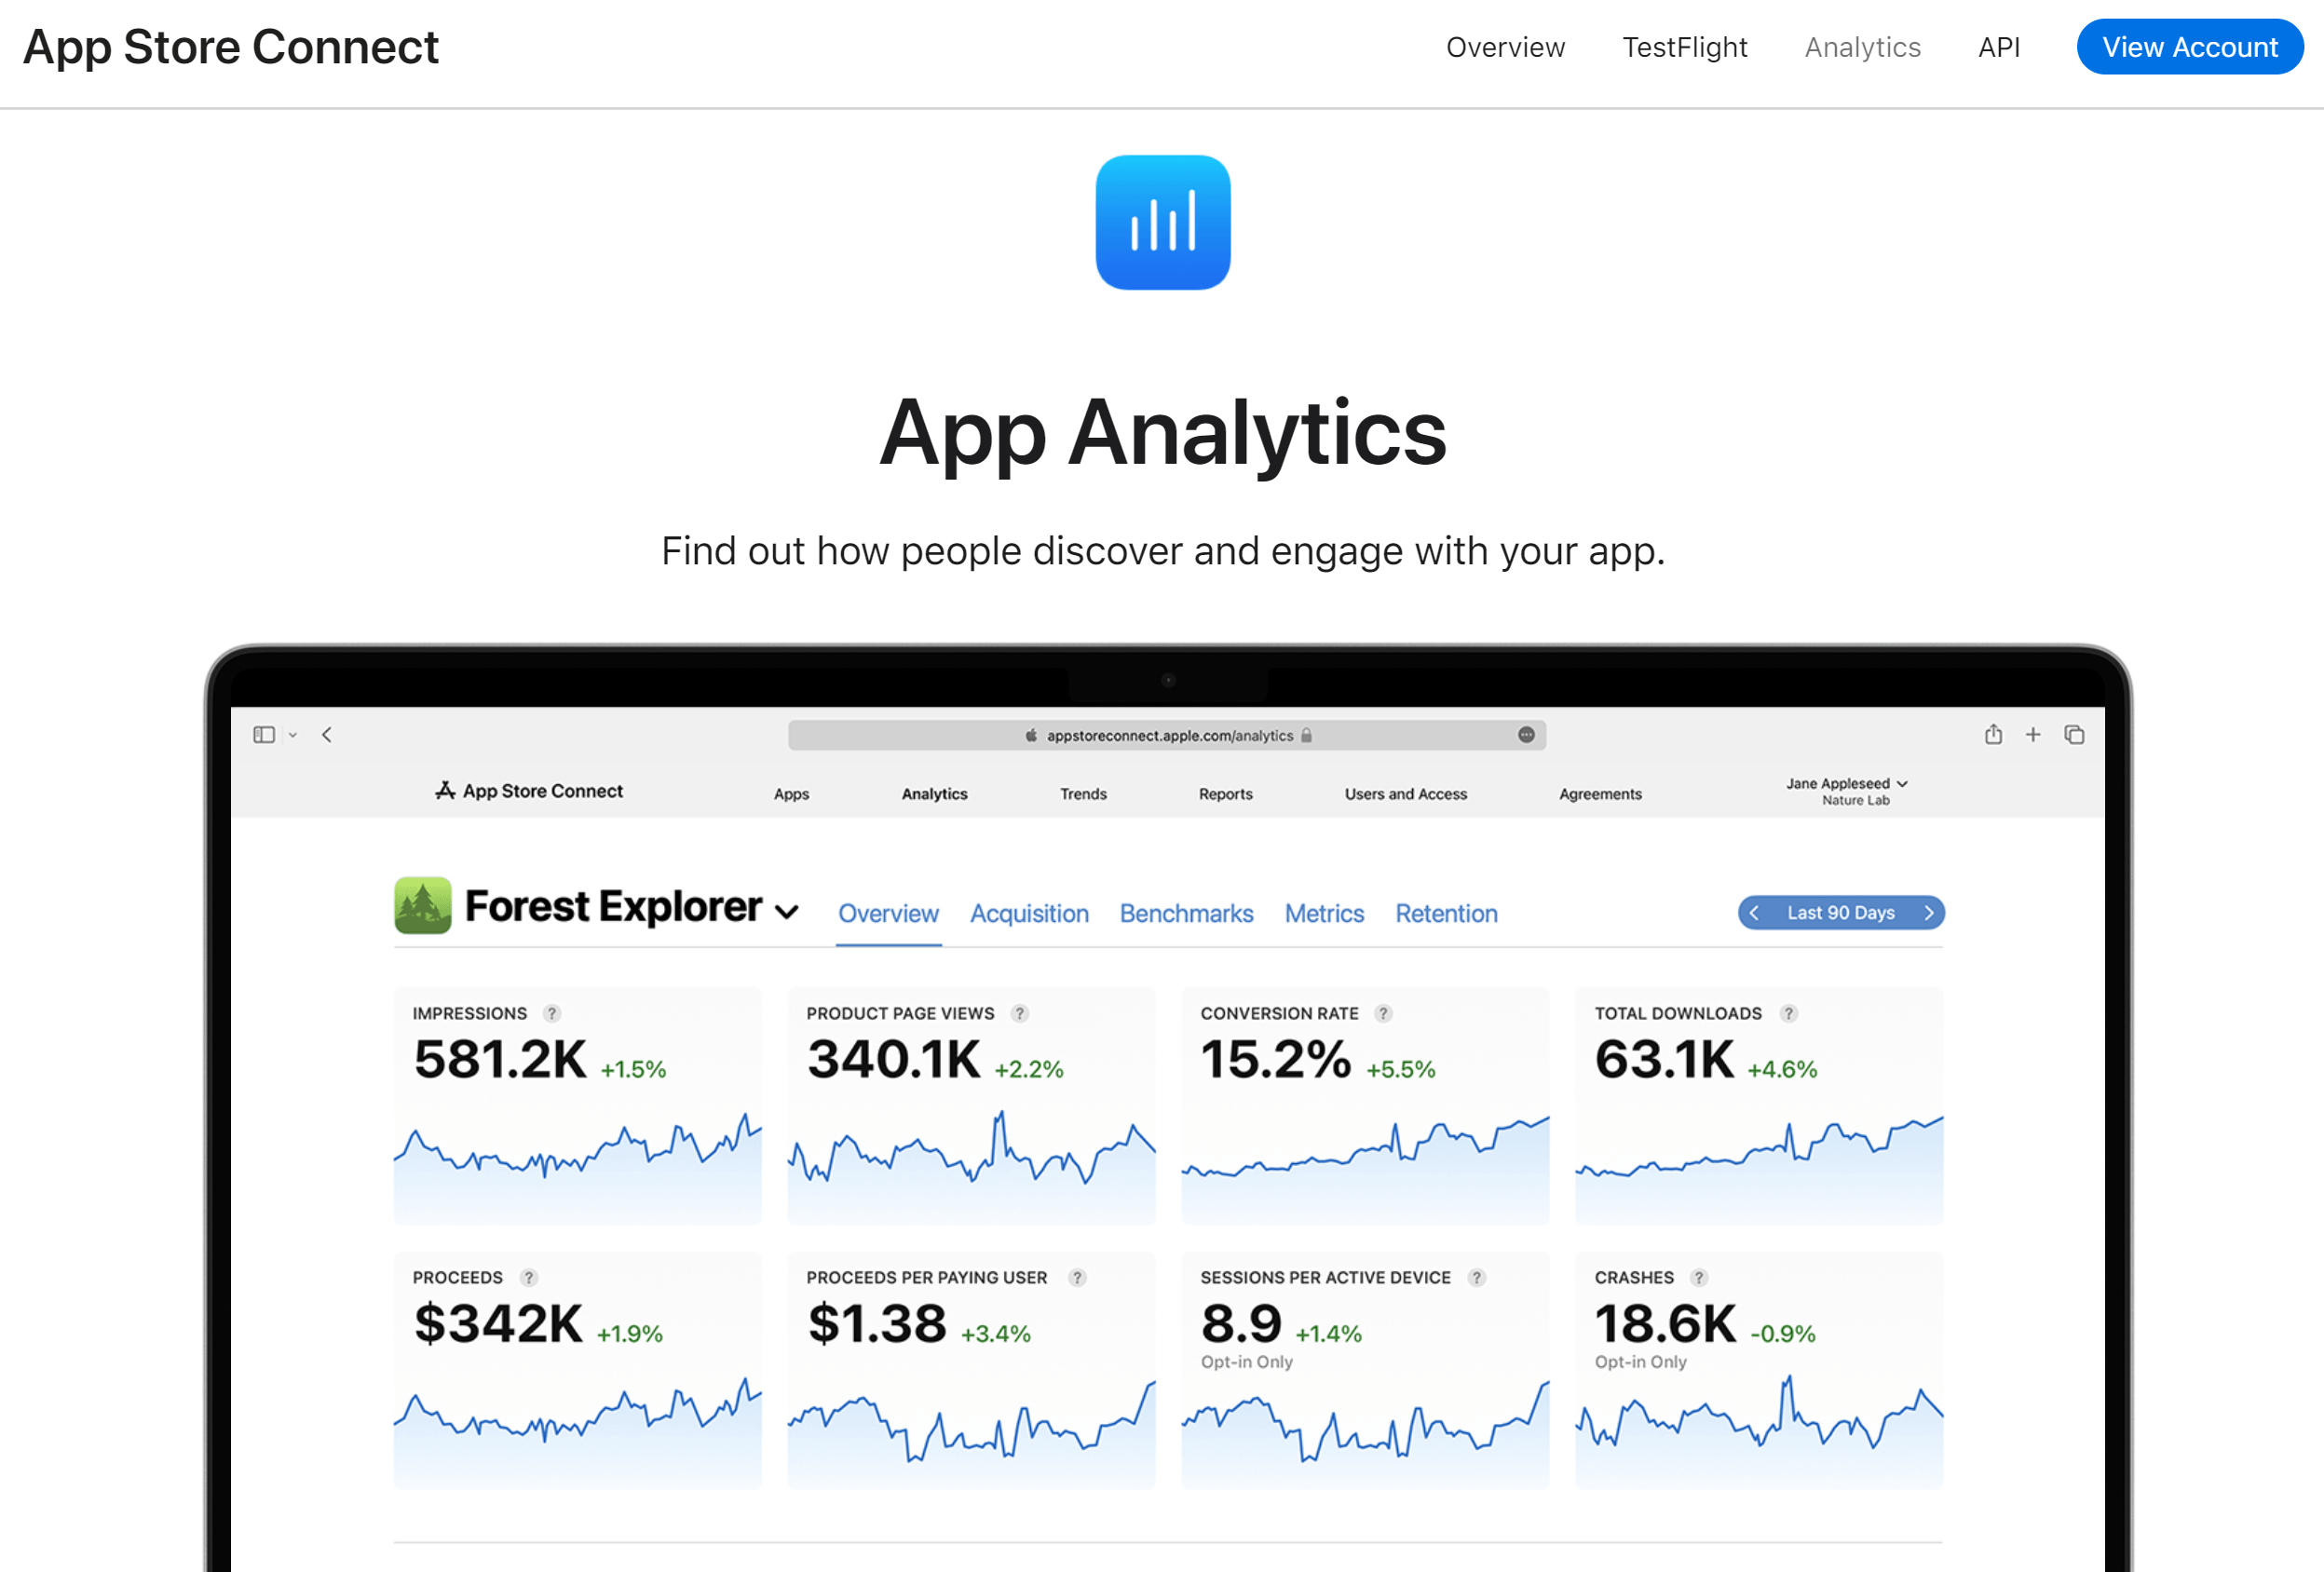 Apple Analytics helps developers and brands track and analyze their app’s performance. It provides data on app usage, user engagement, retention, and more, allowing you to make informed decisions about how to improve your app and drive growth.
Apple Analytics is available to app developers who have an active Apple Developer account and have at least one app available on the App Store.
Overview
Apple Analytics was first introduced in 2015 as a replacement for the previous app analytics tool known as “iAd App Analytics”. The new tool provided more in-depth data and insights for app developers to help them optimize their apps and improve user engagement.
Since its launch, Apple has continued to add new features and capabilities to Apple Analytics to provide even more value to app developers.
Services
Apple Analytics provides its customers with the following services:
- Insights into how users are engaging with the app, including the number of sessions, active devices, retention rates, and more
- Track the effectiveness of your marketing campaigns by measuring the impact on app downloads and user engagement
- Access to data on in-app purchases and revenue generated
8. Adobe Analytics
 Adobe Analytics is an analytics and marketing tool that allows businesses to track and analyze customer interaction for their mobile apps and social media channels.
Adobe Analytics provides a wide range of features to help you understand your customers and optimize your digital experiences, including real-time analytics, customizable dashboards, and data visualization.
Overview
Omniture, the company that created Adobe Analytics, was founded by Josh James, John Pestana, and Brett Error in 1996. Adobe Analytics itself was created in 2005 and later acquired by Adobe in 2009.
Thousands of businesses and organizations across multiple industries use Adobe Analytics to gain insights into their mobile data and improve their marketing strategies.
Services
Adobe Analytics provides its customers with the following services:
- Real-time analytics that enable businesses to monitor their mobile performance and respond to changes quickly
- Allows brands to segment their audience based on various criteria, such as demographics, behavior, and location
- Marketing attribution services that help you understand the impact of your marketing campaigns and optimize your marketing spend
9. AppMetrica
 AppMetrica is an app analytics tool developed by Yandex. It provides developers with real-time data on user behavior, in-app events, crash reports, and user retention rates.
AppMetrica also offers advanced features such as cohort analysis, A/B testing, and push notification campaigns. It supports both iOS and Android platforms and can be integrated with third-party services, including Google Analytics and Firebase.
Overview
AppMetrica was founded by Yandex in 2016. Yandex is primarily known for its search engine but has expanded into other areas, including eCommerce, ride-hailing, and app development.
AppMetrica was created to provide app developers with a powerful analytics tool that could integrate with Yandex’s other services, such as Yandex.Direct and Yandex.Market. AppMetrica has gained popularity among developers due to its rich feature set, reliable performance, and flexible pricing options.
Services
AppMetrica provides its customers with the following services:
- Provides detailed information on user behavior, app usage, and user acquisition channels in real time
- Developers can track specific in-app events, such as purchases, sign-ups, and app launches
- Can detect app crashes and provide detailed crash reports to help developers identify and fix issues quickly
10. SocialPeta
 SocialPeta is a marketing intelligence platform that provides ad intelligence, creative insights, and marketing strategy analysis for app advertisers. It allows marketers to analyze and monitor mobile ad campaigns across various ad networks, including Facebook, Google, and X.
SocialPeta’s database contains 70 million ad creatives from over 50 countries, making it a valuable resource for mobile marketers looking to stay up-to-date on the latest trends.
Overview
SocialPeta was founded in 2016 by a team of entrepreneurs and ad tech experts in China. The company is headquartered in Beijing and has since expanded to other regions, including the United States and India.
The founders of SocialPeta include CEO Yuqing Liu, who has over 10 years of experience in the ad tech industry, and CTO Jun Wu, who has a background in big data and machine learning.
Services
SocialPeta provides its customers with the following services:
- An ad intelligence tool that allows advertisers to monitor their competitors’ ad campaigns and discover new ad creatives, strategies, and trends across various advertising networks
- Provides data and insights on ad creatives, including ad format, ad type, ad size, and more. This helps advertisers create more effective and engaging ad creatives for their campaigns
- Allows advertisers to analyze their competitors’ marketing strategies and identify opportunities to optimize their own campaigns
Why should I use mobile app analytics tools?
Once you launch your app, you want to know how your users are engaging with the app’s services, and what features they are finding useful as well as the issues they may be running into.
Reading reviews and ratings as a way to understand your app’s success is one way to do it. But there is even more valuable data you can benefit from when having access to it.
User behaviour and customer satisfaction are critical components to any business, as the more users and customers you acquire the higher your conversion and retention rates become – more business from more customers, right?
So it is important to know which areas of your app need to be further optimized for growth, performance and customer satisfaction. Using app analytics tools, you can accurately measure and analyze traffic, and identify your best options to spend your resources wisely, pushing your app further in the highly competitive market.
Implementing mobile analytic tools will also help you answer key questions about your app, illuminating the efficiency of the functionalities of your product with the valuable data.
The questions may include the following:
- How many installs have I received?
- How many clicks have I received?
- What are my app’s most popular features?
- What are the personas of my active users?
- What are my conversion, retention & churn rates?
- What services increased engagement and conversions?
- Which marketing strategies were most effective?
Mobile analytics platforms will therefore assist you with increasing your ROI, providing detailed insight into your app users. By answering the questions above, you can take your previous successes and failures as well as features and channels that are and aren’t working as a guide to create an even better strategy.
Now that you understand the importance of utilizing analytics tools for your app, let’s take a look at the different types of platforms and how they can be significant to your company’s growth.
Types of mobile app analytics tools
App Analytics tools can be divided into multiple micro categories, such as app marketing analytics, in-app analytics and app performance analytics.
Here is a brief description of each category in order for you to understand which type may work in favor of the success of your app.
In-app analytics
In-app analytics describes everything a user does within an application. Implementing mobile analytics tools for this category provides you with data on how users behave and interact within your app.
In-app analytics tools let you in on key metrics, such as device information, user demographics and user behavior.
When looking for device information, this tool can tell you what kind of device users are navigating through your app, and how the device influences performance: for example, does the model or OS version have any effect on their behavior? Or, on a particular device, is the ‘install’ button hidden behind another one?
Within user demographics, you can obtain data on language, gender, location and if your users are new or returning ones.
User behavior is the crucial one to consider, as it shows how users behave within your app, and how their interactions lead (or don’t) to higher installs and conversions.
There is infinite data to track here, including where people click on an app, which feature is most used, how long they spend on a page and which pages lead to higher conversions and why. But they are all crucial data that needs analyzing.
To sum up, the main metrics that are tracked using in-app analytics tools are the following:
In-App analytics KPIs
-
-
- Device type: manufacturer & operating system
- In-app behavior: clicks, levels completed, features used
- Location, gender, age and language of users
- Whether user is new or returning
- Number of installs & downloads
- Session duration
- Conversion rates & revenue
-
These insights can indicate what needs to be improved, which could be content, product or app design. Nonetheless, they help you understand who exactly your users are through relevant data, such as attributes and personas that will inform the post-publishing development and further enhance UX for maximum ROI.
App performance analytics
While this category is technically still within the in-app realm, it is less concerned with the users and more focused on the ‘machine’ itself. So it is the groundwork upon which all of your other app analytics types rest.
App performance analytics are the backbone of optimizing your app – without this set of data, it will be next to impossible to retain users, because if an app doesn’t work or crashes every few minutes, as a user you wouldn’t find it that appealing, would you?
Generally speaking, performance analytics tools conduct audits, identifying any errors that may occur while the app is running. From uptime (how long an app tab is kept open) to crashes, responsiveness and resource usage, you can understand when your app works, slows down or fails on various devices.
If your mobile app crashes whenever it is opened on an iPhone Xs, but not on any other model, you definitely want to know about it before all of your app marketing efforts go to waste.
Here are some KPIs that you want to prioritize when utilizing this tool:
App performance KPIs
-
-
- Carrier latency
- API latency
- Uptime
- Crashes
- Exceptions
- Technical errors
- Data transactions
-
App advertising analytics
On top of generic app analytics that cover the technical and users’ performance of your app, you get analytics tools that cover the app’s performance on marketing channels.
This tool should be the heart of any successful app advertising campaign, and what makes ROI calculation possible. According to Statista Digital Market Outlook, in 2017, the total global digital advertising revenue was $228 billion and is set to reach $332 by 2021.
Planning and executing advertising campaigns based on hard data always makes sense, but when it’s about spending several hundred billion dollars a year it is simply a must-do.
App analytics tools should be your bread and butter when implementing ad campaigns. It helps you analyze and attribute digital marketing campaigns to ad clicks and, subsequently, to app installs, in-app behaviors, giving you an instant mobile in-store or offline sales boost.
Among other metrics, app advertising analytics tools allow you to measure returns on advertising spend as well as the effectiveness of ad impressions. This way, you can better target your ads and understand the effectiveness of your spending.
So for each traffic source, marketers can understand what is working and what is not, and optimize their campaigns accordingly.
To get a better grasp on what app advertising analytics companies can do for your advertising needs, here are crucial metrics and their definitions you should pay attention to when using this tool:
App advertising KPIs
-
-
- CTR (click through ratio): the ratio between the number of instances when an ad was displayed and clicked through
- CR (conversion ratio): the ratio between the total number of people who interacted with your ad and took actions (e.g. install, purchase, etc.)
- CPC (cost-per-click): how much a single click on an ad within an app costs
- eCPM (effective cost-per-mile): the effective cost of 1,000 ads displayed in your app
- CPI (cost-per-install): the cost of when each user installs an app
-
App marketing analytics (a.k.a. app store analytics)
Last but not least, we have the infamous analysis of how your app is marketed within the app stores, including where and how it is found across various platforms.
Did you know, on a global scale, app downloads are decreasing? And in 2015, there were around 1,000 apps uploaded to the Apple App Store every day.
So how do you stand out from the crowd? The answer is, through top level app store advertising and marketing.
CMOS stated in their 2016 survey:
“Spending on marketing analytics … is expected to leap from 4.6 percent to almost 22 percent of marketing budgets in the next three years.”
Ad campaigns can include all sorts of aspects, from adverts to offers and cross-promotion. But to understand what works and what doesn’t, you will definitely need to take advantage of marketing analytics.
App Store analytics supply brands and developers with analytical data on their mobile app marketing performance. It reports on how changes of your target keywords, meta data and other integral parts of your app marketing campaign influence your visibility and performance in the app store .
Moreover, it reveals data of how users locate your app: do they find your app while browsing the App Store or on other websites?
App marketing analytics provides you a great overview of the number of downloads as well as in-app purchases, indicating how well your app is optimized in app stores (App Store Optimization).
With this type of analytics you can also monitor and analyze KPIs of your mobile app marketing campaigns, and keep tabs on your competitors’ performances, including their app installs, rankings and revenue across multiple app stores.
Here are the core KPIs when using marketing analytics:
Marketing analytics KPIs
-
-
- Installs: not only how many times your app is installed, but the path that leads people to installing an app
- Views: when is your app viewed? Is it following a particular deep link, or did users of another app switch over to yours?
- Purchases: when people purchase something within your app (or when do they purchase the app itself)
- Registration: if the app requires a registration, understand why people decided to register
Content viewed: which pages are viewed specifically - Shares: on which platform and why a link to your app or its content is shared?
- Invites: not only how many invites, but also who invites and who gets invited (insight into demographics)
- Custom events: this metric is set by you, for example, to find out when people have followed the ‘customers who bought this also liked’ link
-
How do I use analytics tools for my mobile app?
Finding an app analytics platform that suits your business is essential, but it is also important to be able to make sense of the data that these tools generate for you.
A better understanding of data analysis will allow you to test your app’s performance and functionality to then know if your app can be an effective problem-solving tool for your users – and if not, what needs to be improved.
But what does one do with the endless metrics and data presented to us? And how does one link the results from our app analytics tools to actual improvement points for the further development of our apps?
We will briefly discuss the best ways to analyze mobile app analytics data.
But first, let’s look at some crucial metrics and KPIs you should be tracking when using mobile app analytics, to make the most of the tool:
Retention rate
This metric describes the percentage of users that still use your app, while also giving you the number of customers you are losing.
Retention rate is as important as your user acquisition rate. As much as attracting new users should be an integral part of your app marketing strategy, you want to hold on to those loyal users that are at the core of your app’s success, avoiding your churn reaching higher rates.
User churn & uninstall rates
User churn provides a ratio between the number of loyal app users, after a certain period of time, usually a month, and users who have stopped using your services.
According to Localytics data, in 2016, aggregated across multiple app categories, the average churn rate was 36% for one month and only 20% over the course of three months.
Tracking the number of people who uninstall your app is also vital to understanding why they decided to uninstall your app, and at what point.
Average revenue per user (ARPU)
ARPU reports on how much revenue your app generated per user, which is an extremely important metric, as it tells you how much money you are making from each user within a specific timeframe.
This metric is calculated by dividing the total revenue of your business within a selected period by the average number of users within the same set time frame.
Return on investment (ROI)
The ROI rate represents what you have spent against how much you have actually earned, evaluating the efficiency and profitability of your investments and efforts.
This measure is the difference of the benefit of your spending, divided by the actual sum of your investment.
User growth rate
This figure represents the number of new users acquired within a specific period, which is another metric you want to look out for to measure the success rate of your app.
Session length
A session is the time actively spent by a user on your app before closing it or switching to another app. The metric also describes the length and frequency at which a user interacts with your app, providing insights into trends of your services.
According to Opera Mediaworks, in 2016, the average app session length was five minutes.
Daily & monthly active user
You may also want to focus on the daily and monthly active user rates, as they measure the number of users that open and engage with your app on a daily or monthly basis.
It is a metric that also measures growth, churn and an active user’s depth of engagement level.
In the app world, a prime measure of an active user would be them making an account in your app, just how making a money transfer would be a sign of engagement on an online banking app.
So it is as important as knowing how often a user accesses your app.
Now that you know the key metrics you want to prioritize when analysing your app data, let’s dissect the best methods on how to use mobile app analytics tools:
Map out your user’s journey
A user’s journey describes how a user cycles from discovering, installing or purchasing, to using the services of your app. Defining the steps of this journey is crucial to getting a better insight into your user’s behaviors and how they typically interact with your app and its features.
Once you have mapped out the user funnel, along with the data gathered with analytics tools, you can easily spot where your users churn, what peaks their interest as well as their preferred features.
This analysis allows you to efficiently optimize your user journey, which will enhance your users’ experience, generating more revenue and driving those conversion rates.
Track only relevant metrics
Now that you have determined your generic user journey and know your business’ objectives, you will know the exact metrics that are critical to the improvement of your app.
As we have listed countless of valuable KPIs and metrics above within the different types of analytics tools, it is useful to select the measurements that will add the most value to your unique performance optimization.
You want to focus on the metrics that matter, without wasting too much time and money on data that are not part of the usual functions of your app. These metrics are less likely to add value to your optimizations and enhancements.
Ask yourself questions that are tailored to your individual app requirements. These questions should outline if certain efforts are being made and accomplished towards your company goals.
Ensure that you are picking up on the data provided by the mobile analytics tools that specifically answer those key questions.
Ace the initial user experience
You know your app will be the ultimate game changer to anyone who uses it. But how will users know its potential?
Your marketing efforts have done a fantastic job in attracting users and impressing them well enough to hit the ‘Get’ button. But the challenge and true magic lies within introducing your new customers to the valuable services that your app ad promised, in the best way possible.
As it is said, first impressions are everything. So the initial experience in the onboarding or signing up stage is the determining factor of whether or not your users will continue using your app.
For example, improve the onboarding experience by simplifying its process, making the first actions as simple as clicking one button to activate their account. Refer to the personas of your target users and tailor the sign-up stage based on those.
Once you have enhanced this crucial part of your user journey, analyze the activation metrics that inform about the rate (and speed) at which your acquired users turn into active users by an activation event.
Onboarding metrics typically include:
-
-
- Activation
- Install to Registration
- Download to Launch
- Cost per Registration rates
-
Make sure to track these KPIs and understand if users can easily go to the next level of your app from the onboarding step.
Take advantage of A/B testing
After you have gathered all of the data from your analytics, A/B analytics is definitely a tool you want to take advantage of to guarantee positive responses to any enhancements you make based on your KPIs.
A/B testing works by dividing your customers into two or more groups, and testing how a new feature, which may involve changes to the design or experience, impacts user behavior. This way, you will be able to identify which option works best for users and what function is more preferred, before you make the permanent change.
When testing the new feature on a control group within your app, make sure not to disrupt the flow of the app that may put off your customers. See that you make the transition as smooth as possible.
Mobile analytics for new ideas
App analytics tools don’t only have to give you ideas on how to change your app, but also to inspire you to take your product to new levels.
Analyzing key metrics may illuminate entirely new opportunities, motivating you to find new initiatives to grow your app further.
You may find some pages are driving less traffic than others, or that some services are being used more. You can expand the stronger functions and give your customers more of what they want.
How much do mobile app analytics tools cost?
App analytics costs and their pricing plans are one of the key things app owners look at, as mobile analytics platforms tend to have different tiers, offering a wider range of metrics, data points and features the more you pay.
If your app is unlikely to generate larger amounts of data, or only requires to track a few key metrics, then perhaps you don’t need to opt for the ‘full features list’ tier.
Some platforms are even free of charge, while other app analytics tools offer a free package – but only as long as you stick to the very basic features, which may leave you rather constrained in your limitations and abilities to grow your app further.
Costs will differ from platform to platform, but just remember that investing in efficient app analytics tools will play an integral part in your app business and its success.
How do I choose the best mobile analytics software?
The real difficulty and challenge of taking advantage of app analytics tools is understanding how to make sense of all the data and what to do with it.
The main reason app marketers don’t prioritize the use of app analytics and its complex categories is not knowing the true, valuable purpose and advantages of them.
But at this point in the guide, you must be an expert in knowing your way around mobile analytics platforms. So let’s delve deeper into how exactly to select the best app analytics platform for your unique app, and what factors to base your decision on.
What key features do the platforms offer?
Apart from looking at the pricing plans of each app analytics platform, you also want to find out what key features they provide, on top of the basics, such as A/B testing, push notifications and tracking fundamental KPIs.
The mobile analytics platform’s unique selling point, including any specialized services they provide, are crucial to understanding how they stand out from the rest.
What does your app need?
You want to find a platform that works best for your individual app.
For example, if your app is going to be used within your enterprise only by a few people, performance analytics may be more important to you than user experience.
In another instance, if your app is highly original and standard analytics wouldn’t be able to give you adequate insight, tools that offer customizable metrics may be the better option for you.
What level of support does the app analytics platform offer?
You want an app analytics platform that offers the right support when and where you need it. So pay attention to the kind of level of support they provide.
How much documentation does the platform offer? Do they have a 24/7 hotline or account managers to help you when things go wrong?
The tools you choose to analyze your app data with should not let you down, as this can impact your app performance when you lose track of key metrics and their history.
Make sure your choice factors in good support from knowledgeable experts.
What kinds of SDKs do they offer?
Most of the mobile analytics platforms offer software development kits (SDKs), with a very easy implementation process – sometimes as simple as a single line of code.
Other SDKs can be much more complex and complicated, potentially even slowing down your app functions and loading speed, hence affecting its performance.
You therefore want to ensure that the analytics tools you choose for your product are fully compatible with your app and easy to use.
Work with app analytics tools & platforms
We hope we have made it easier for you to choose from our carefully selected list of top app analytics platforms, with more in-depth know-how and a better expertise in the tools and typical mobile analytics processes.
With your new, improved understanding of the world of app analytics, choose the best mobile analytics platform that offers powerful and efficient tools, including specific metric tracking and simplified SDKs, and covering a range of data that works best for your unique app.